
A regional SEO strategy works when you concentrate your budget on the handful of cities that can actually pay you back and deliberately skip the rest. Most regional businesses do the opposite. They map every town within a two-hour drive, generate a city page for each one, and spend a year ranking nowhere while a competitor with eight strong pages takes the revenue in the markets that matter. Coverage feels productive. Concentration converts.
This guide lays out how we build regional campaigns at Emulent: how to choose your markets, what counts as provable presence in each one, how the AI layer changed the scoreboard in 2026, and what to measure so you know the work is producing customers instead of decorations.
Why Coverage Thinking Fails
Google devalued templated city pages years ago, and the quality bar has only moved up since. A page that swaps “Durham” for “Cary” above the same 600 words does not read as presence to Google’s systems. It reads as a doorway, and doorways get filtered out of the index or parked on page four where nobody sees them. The 40-page city blitz fails on the search side before a buyer ever weighs in.
It fails harder on the buyer side. A homeowner in Cary evaluating a roofer wants evidence the company has stood on roofs in Cary: jobs completed there, reviews written by neighbors, photos that show her own kind of street. A page that merely names her town supplies none of that. Naming a market is free, so it signals nothing. Proof costs something, and buyers have learned to price the difference. That is costly signaling in action, and it explains why thin city pages convert so poorly even on the rare occasions they rank.
“When a prospect shows us 45 city pages and asks why the phone is quiet, we ask one question: which five of these cities wrote you a check last year? Build for those five. Delete the rest. Nobody wants to hear it, and it works every time.” – The Strategy Team at Emulent
The math backs the discomfort. Ten hours of effort spread across 40 pages buys you 15 minutes of substance per market. The same ten hours concentrated on five markets buys real photography, real completed-project write-ups, and real review generation in each. One of those allocations produces an asset. The other produces a sitemap.
Pick the Cities That Can Pay You Back
Your market list comes from your revenue records, not from a radius tool. Pull two years of customer data and sort it by city. The pattern is almost always the same: a home market that produces 40 to 60 percent of revenue, three to seven secondary cities that produce most of the remainder, and a long tail of towns that produced one job each. That tail is where regional SEO budgets go to die.
We sort every regional footprint into three tiers:
- Tier 1: the home market. Where your address, most of your reviews, and most of your history live. It gets the deepest investment: full service pages, the strongest review velocity, and your Google Business Profile’s center of gravity.
- Tier 2: revenue markets. The three to seven cities your customer data proves out. Each earns a genuinely distinct page built on local evidence, plus its own review generation push. This is what a Google local SEO service engagement actually consists of when it is done honestly: fewer pages, each defensible.
- Tier 3: everything else. Covered by a single service-area statement and your profile’s listed coverage. No dedicated pages until a market produces enough revenue to graduate into Tier 2.
Here is the distinction that sets this apart from the advice you will read elsewhere: if a city has not produced a customer in two years, it does not get a page. Not a short page, not a “we also serve” page. The demand either is not there or your operations cannot profitably reach it, and a web page fixes neither problem. Some readers should build fewer pages than they planned and spend the difference on photography and reviews. That advice reduces our billable scope, and we give it anyway, because the alternative is charging you to build inventory Google will ignore.
Two filters refine the tiers. First, drive time against job value: a $12,000 remodel justifies a 90-minute radius in a way a $150 service call never will. Second, the competition check: search your service plus each candidate city and read who holds the map pack. A Tier 2 city where three entrenched competitors hold 400 reviews each may be a worse bet than a smaller town where the pack is weak. For brands weighing several markets at once, our breakdown of local SEO pricing for multi-location brands shows how cost scales with each added market, which makes the case for pruning even plainer.
Build Provable Presence, Not Keyword Coverage
Every Tier 1 and Tier 2 market needs evidence a stranger could verify. Four kinds of proof do the work:
- Reviews from that market. Reviews that mention the city by name are the strongest corroboration you can earn, because a customer wrote them, not you. Ask for them, job by job, in the market you are trying to grow in.
- Photographs of real work in real places. Original photos of your crew, your projects, and recognizable local settings beat stock imagery in both rankings and conversions. This is where brand photography stops being a branding expense and starts being a local ranking asset.
- Completed-project write-ups. A 300-word account of an actual job in an actual neighborhood, with photos and the problem solved, outperforms 1,000 words of generic service copy tagged with a city name.
- Consistent entity signals. Your name, address, phone, and service list must match across your site, your profiles, and the directories that matter. Our guide to local entity SEO covers how Google assembles these fragments into a confident picture of who you are and where you operate.
“Buyers do not believe claims. They believe evidence they could check themselves. A review from their own zip code, a photo of a street they recognize: that clears the trust threshold. A page that says ‘proudly serving’ 30 towns clears nothing, because saying it cost you nothing.” – Bill Ross, Founder of Emulent
Notice what is absent from the proof list: keyword density, word counts, and town-name synonyms. Those are coverage artifacts. Google’s local systems, and now the AI systems sitting on top of them, are corroboration engines. They cross-reference what you say against what customers, photos, and third-party platforms say. When the accounts agree, you surface. When only you are talking, you do not.
The Scoreboard Moved: AI Recommends Now
The single most important number in regional search this year comes from BrightLocal’s Local Consumer Review Survey 2026, a February 2026 study of 1,002 US adults: the share of consumers using AI tools such as ChatGPT and Google AI Mode to discover local businesses jumped from 6% in the 2025 survey to 45% in 2026. Over the same year, Google’s share of local business discovery fell from 83% to 71%. Nearly half of your regional buyers now sometimes receive a recommendation instead of a results page.
We project AI discovery reaching roughly 62% by 2028 and then bending flat, not climbing forever. Adoption follows an S-curve: it accelerates past a visibility tipping point, which 2026 clearly crossed, then decelerates as older cohorts and change-resistant buyers hold out. Gartner’s forecast points the same direction we do; we weight our curve slightly more conservatively because BrightLocal’s figure measures occasional use, not primary use.
What earns an AI recommendation looks suspiciously like the proof list above. A June 2026 Local SEO Data study comparing Google’s Local Pack against Google AI Mode found that 28.5% of businesses ranking in the pack were invisible in AI Mode for the same searches, and that businesses appearing only in AI Mode had 49% more reviews at the median than pack-only businesses. That comparison is observational, so heavier-reviewed businesses likely run stronger operations across the board, but the direction of the effect is hard to argue with: the AI layer leans on third-party corroboration even more than the pack does. Getting recommended is the discipline our AI SEO work is built around, and it extends past Google to every assistant your buyers ask, which is why we treat search everywhere optimization as one program rather than a stack of channel projects.
The Local Pack Shield, and Where It Is Thinning
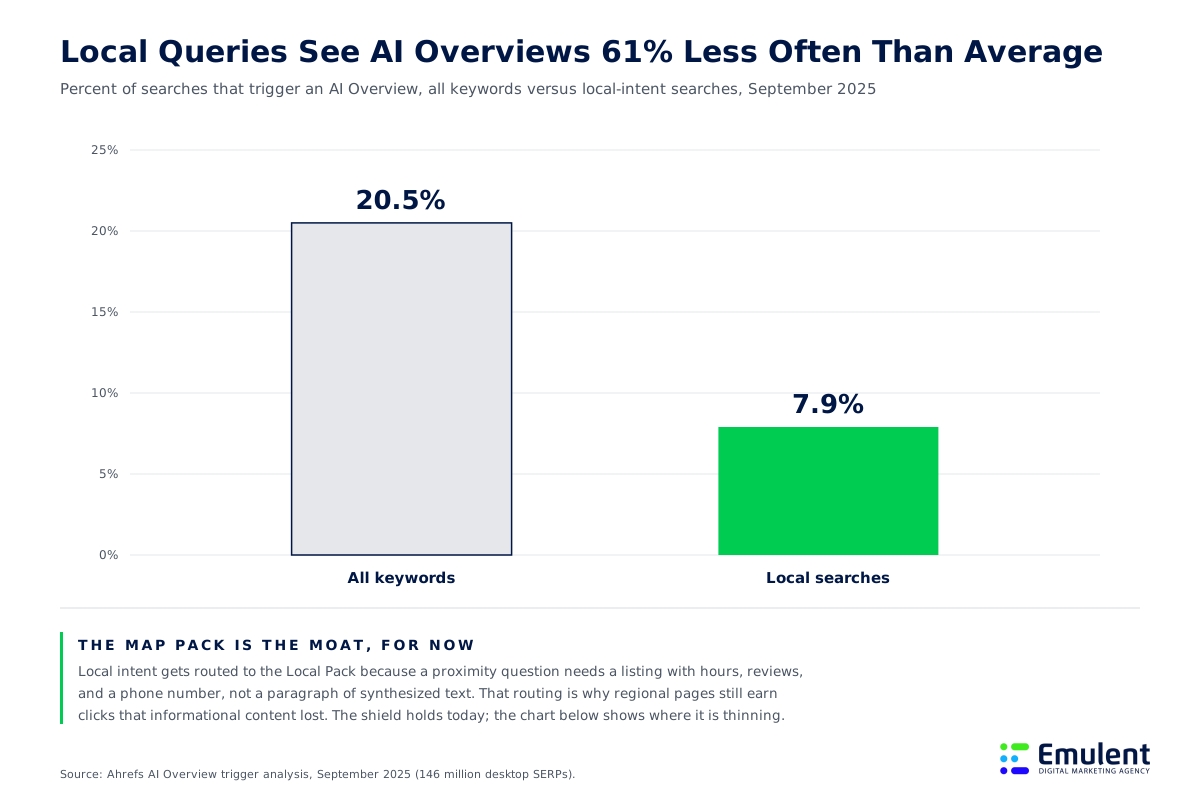
Regional businesses hold one structural advantage in the AI Overview era, and the data on it is clear. An Ahrefs analysis of 146 million desktop SERPs from September 2025 found AI Overviews appearing on 20.5% of all keywords but only 7.9% of local searches. When someone types a service plus a city, Google still routes the query to the Local Pack, because a proximity question needs a listing with hours, reviews, and a phone number rather than a paragraph of synthesized text.
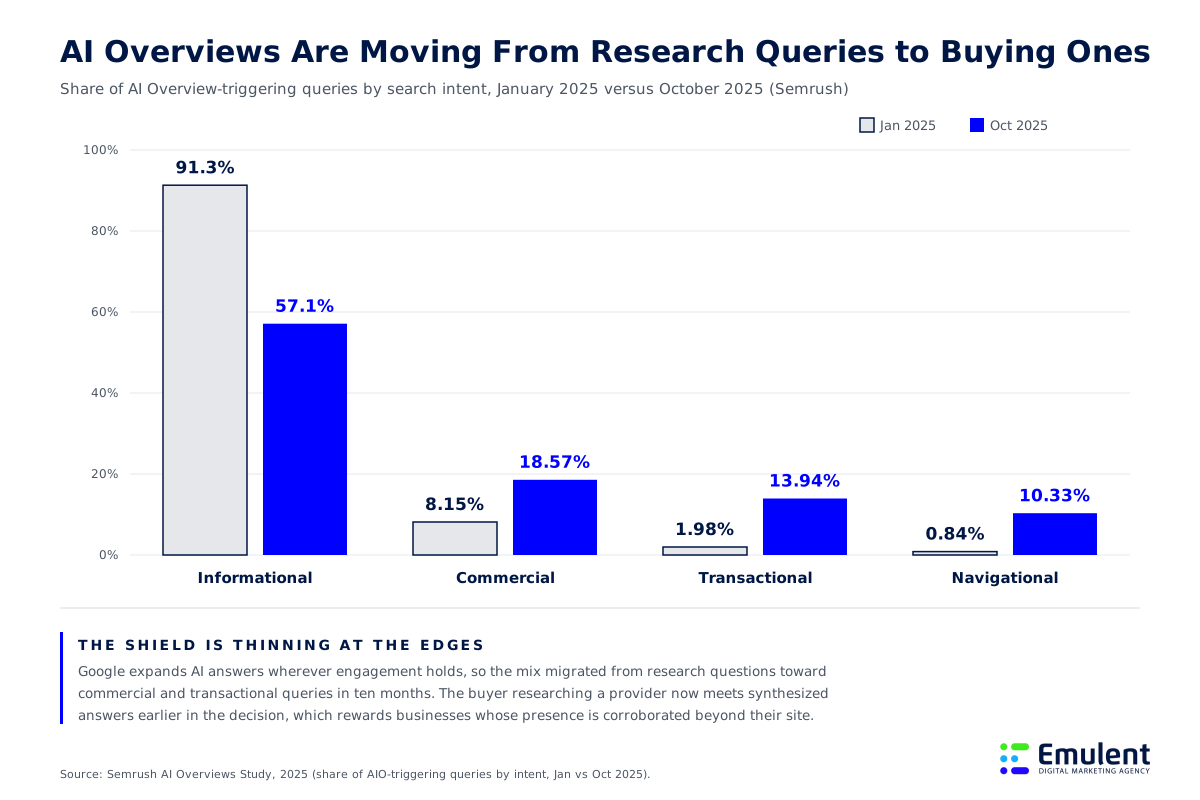
The shield is real, and it is thinning at the edges. The Semrush AI Overviews Study, tracking more than 10 million keywords through 2025, found that the mix of queries triggering AI Overviews migrated hard toward money terms: informational queries fell from 91.3% of the AI Overview mix in January 2025 to 57.1% by October, while commercial queries grew from 8.15% to 18.57% and transactional queries from 1.98% to 13.94%. The buyer researching “average cost of a roof replacement in Raleigh” now meets a synthesized answer before she ever meets your service page.
Our position on what to do with this: own the pack first and treat AI Overview chasing as a second-priority play for research-stage queries only. The pack still answers the highest-intent moment, the moment someone is choosing who to call, and the same review and entity work that wins the pack is what AI systems cite when they do intervene. A campaign that abandons pack fundamentals to chase overview citations has traded the cash register for the window display. For the wider picture of where these surfaces are heading, our state of local SEO report tracks the numbers quarter by quarter.
Reviews Are the Regional Budget Nobody Sets
Review behavior hardened in 2026, and it hardened in the direction of businesses with fresh, market-specific proof. BrightLocal’s 2026 survey found 97% of consumers read reviews when evaluating a local business, and the share who always read them when browsing jumped from 29% in 2025 to 41% in 2026. A 12-point single-year move in a settled consumer habit is rare. It means the review profile you show each market is no longer a tiebreaker; for two buyers in five, it is the first screen you either pass or fail.
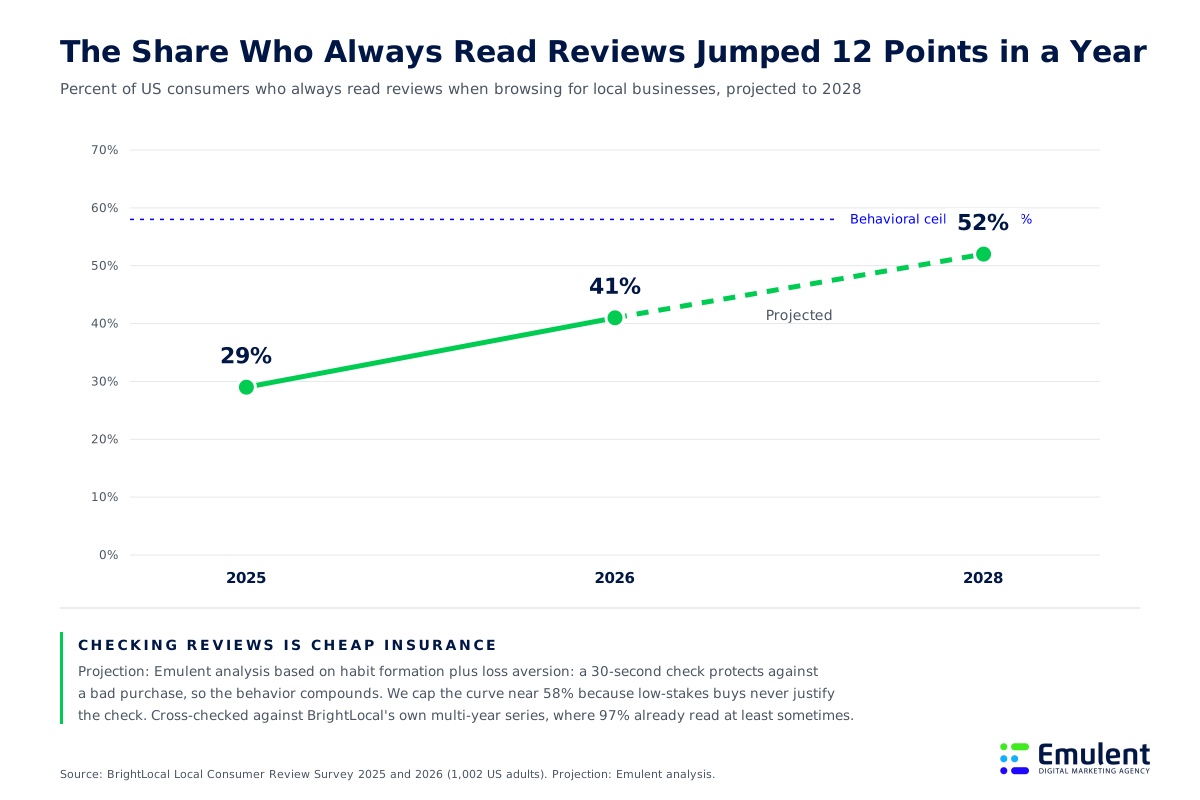
Projection: Emulent analysis based on habit formation reinforced by loss aversion, assuming a ceiling near 58% because low-stakes purchases never justify the check, cross-checked against BrightLocal’s own multi-year series, where the 97% who read at least occasionally bounds the pool.
We project the always-read share reaching roughly 52% by 2028. The mechanism is loss aversion doing what it always does: a 30-second review check is cheap insurance against an expensive mistake, and behaviors that cheaply prevent losses become habits. The curve flattens near 58% because a coffee order will never warrant the ritual a contractor hire does.
The regional implication is the one agencies skip because it is unglamorous: review velocity has to be planned per market, like ad spend. A 4.8-star average concentrated in your home city does nothing for the buyer in a Tier 2 market scanning for reviews from her own town, and it does little for the AI assistant looking for corroboration that you really work there. Reviews now feed two scoreboards at once; our piece on how your reviews affect AI search walks through the second one.
“Clients budget for pages because pages are visible in a proposal. Nobody budgets for 15 reviews per market per quarter, and that line item outperforms the pages. If the choice is a sixth city page or a review system that actually runs, take the reviews. It is not close.” – The Strategy Team at Emulent
Structure the Site for Concentration
The architecture that fits this strategy is a hub and spoke, kept deliberately small. One authoritative service hub per core offering. One location page per Tier 1 and Tier 2 market, each built from the proof inventory above. Service-plus-city combination pages only where the customer data justifies the multiplication, which for most regional businesses means your top two services in your top three markets, not every cell of the grid.
Restraint here prevents a quiet failure mode: ten similar pages competing for the same query until Google ranks none of them well. If your Raleigh page, your “roofing Raleigh” page, and three blog posts all target the same search, you have built keyword cannibalization into the sitemap. Fewer, stronger pages sidestep the problem entirely.
Your Google Business Profile carries more regional weight than any page on your site, so treat it as a primary asset: exact service areas, complete service lists, weekly photo additions, and answered questions. Proximity, relevance, and prominence still govern how Google scores it; our breakdown of local SEO ranking factors explains how the three interact, and our 20-point local SEO checklist turns the setup into a working sequence you can run in an afternoon a week.
Measure Revenue by Market, Not Rankings
A regional campaign has exactly one honest scoreboard: customers and revenue by market. Calls, direction requests, form fills, and booked jobs, each attributed to a city and compared against that city’s tier. A #1 ranking in a town that never calls is a decoration. If your Tier 2 markets are not producing measurable pipeline within two to three quarters of real investment, the strategy needs revision, not patience.
This scoreboard also protects you from chasing surfaces Google itself has not settled. The Semrush panel watched AI Overview prevalence spike from 6.49% of queries in January 2025 to 24.61% in July, then fall back to 15.69% by November as Google recalibrated where the feature earned its screen space.
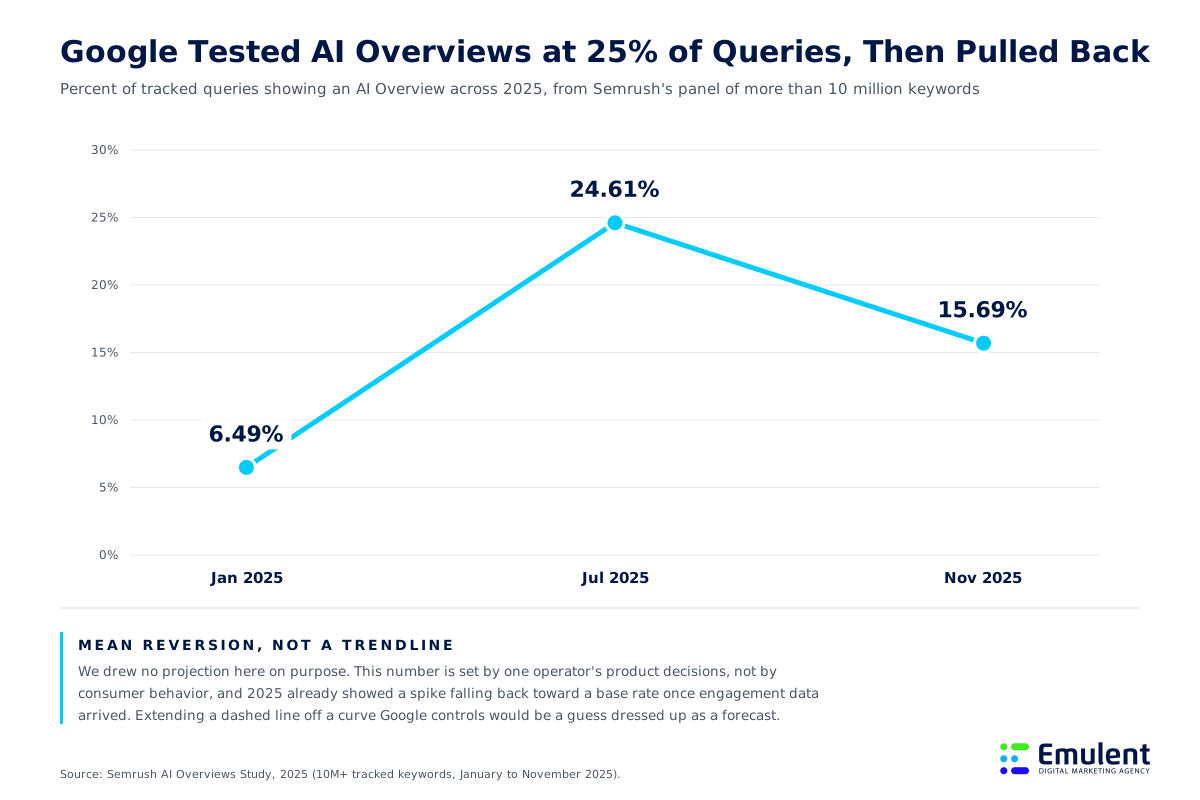
We drew no projection on that chart on purpose. The number is set by one company’s product decisions, not by consumer behavior, and the 2025 series already showed a spike reverting toward a base rate. Any budget reallocated in July 2025 to chase that peak was solving a problem that partially disappeared by November. Measure customers by market, hold the strategy steady, and let Google’s experiments stay Google’s problem. If you have been burned before by a campaign graded on rankings alone, that history is worth a conversation before you spend again; you can talk to a marketing agency about what market-level revenue reporting should look like before any contract gets signed, ours included.
Where This Leaves You
Concentration beats coverage, and everything above is that one claim applied in sequence. Pick the five to eight cities your revenue records already endorse. Build presence in each that a skeptical stranger, a ranking system, and an AI assistant could all verify. Fund per-market reviews like the ranking budget they have become. Skip the 30 towns that never called, and measure the whole effort in customers by market rather than positions on a screen.
The businesses losing regionally right now are not losing for lack of pages. They are losing because their budget is spread across markets that cannot repay it, thinly enough that no single market ever gets convinced. Cut the map down to the cities that matter and the same budget starts winning. That is the whole strategy, and it works because it matches how buyers, and now their AI assistants, actually decide.