
Local SEO ranking factors in 2026 look different than they did even two years ago. Google Business Profile signals still anchor the local pack, but reviews are absorbing share, citations are reorganizing around AI search, and a brand-new category named social signals has entered the survey for the first time. This article maps the eight signal groups, plots how the weights have moved since 2015, and projects where they go through 2028. The data comes from the Whitespark 2026 Local Search Ranking Factors survey of 47 practitioners, with supporting points from BrightLocal and Sterling Sky.
Key takeaways
- Google Business Profile signals hold roughly 32% of local pack ranking influence, and eight of the top ten individual factors come from inside the profile itself.
- Review signals grew from 16% in 2023 to 20% in 2026, the only category posting a meaningful climb across the survey.
- AI search visibility now has its own weighting, and the rankings invert: on-page jumps to 24% while Google Business Profile drops to 12%.
- Review recency leapt from #20 to the top five in individual factor rankings, a 15-position move in two survey cycles.
- Citations are quietly rebounding because LLM-based search relies on directory mentions to verify entities.
- Static optimization is losing ground. Fresh photos, current hours, and recent reviews now outperform set-and-forget profiles.
What signals carry the most weight in the local pack today?
The Whitespark 2026 survey groups every individual ranking signal into eight category clusters. The chart below shows where each category sits in 2026 and where our modeling places them in 2028. Reading the categories in order tells you where to spend your local SEO hours, and where the marginal returns are flattening.
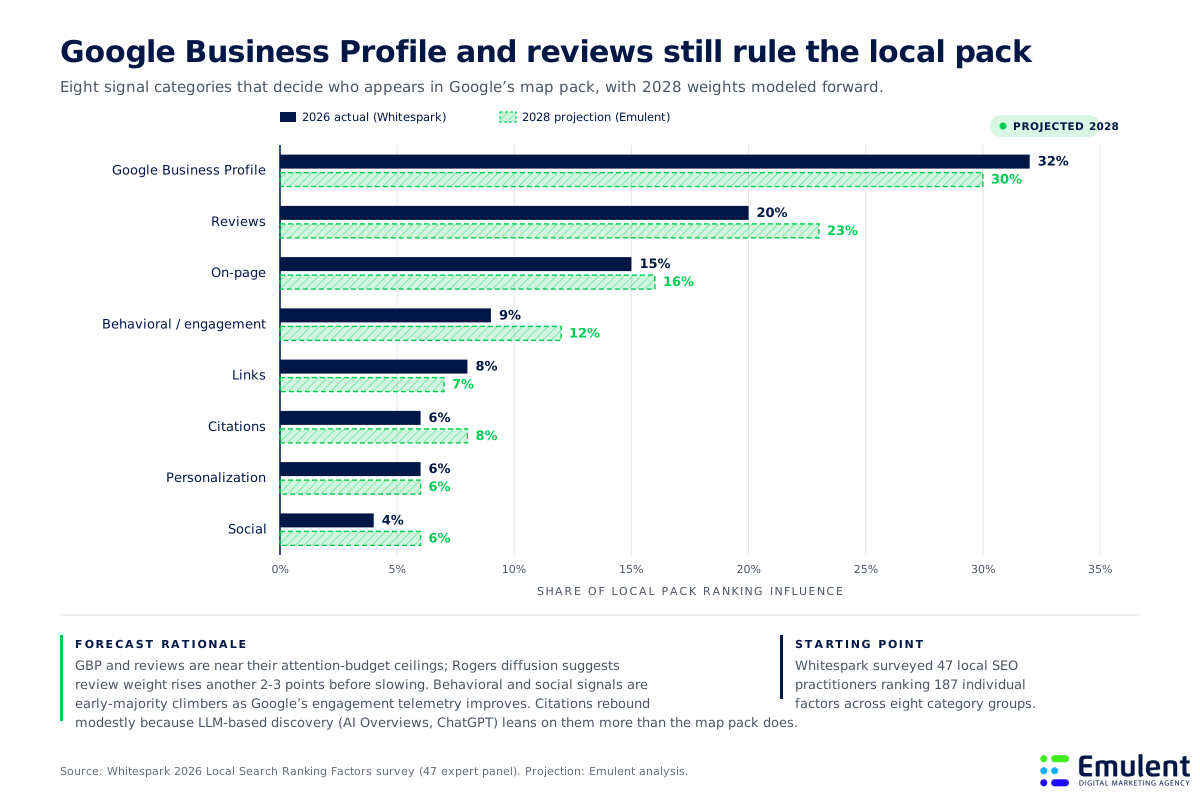
The top three categories cover more than two-thirds of total influence. Google Business Profile, reviews, and on-page signals stack to 67% of ranking weight, which means the remaining five categories together account for one-third. Practitioners new to local SEO services often spend equal effort across all eight, and the data argues against that allocation.
How to read each category in 2026:
- Google Business Profile (32%): Category, name, attributes, hours, photos, posts, services. Eight of the ten highest-weighted individual factors live here.
- Reviews (20%): Volume, velocity, recency, response rate, and sentiment. Recency carries the most weight inside the cluster.
- On-page (15%): Title tags, header structure, NAP consistency, and the presence of city-specific landing pages tied to the profile.
- Behavioral (9%): Clicks, calls, direction requests, dwell time. Engagement telemetry Google reads after the user sees a result.
- Links (8%): Domain authority, anchor relevance, and inbound links from locally relevant sites.
- Citations (6%): Directory listings, NAP parity, and curated industry lists. Lower for local pack, higher for AI search.
- Personalization (6%): Search history, device, prior visits. Largely outside your control.
- Social (4%): New for 2026. The survey panel confirmed measurable signal from Facebook, Instagram, and LinkedIn activity.
The 32% Google Business Profile weight is not a sign that the profile is the only thing that matters. It is a sign that the profile is the easiest place for Google to read a clear, verified signal. Everything else competes for the remaining 68%, and on the controllable factors that 68% is where good operators actually pull ahead. – Strategy Team, Emulent
That allocation has been moving for a decade, and the direction of travel matters more than any single year’s snapshot. The next chart pulls back the camera.
How have local ranking factor weights shifted over the last decade?
Whitespark has run this survey every two to three years since 2015. Lining up the survey waves shows a clear pattern: weight has been migrating away from links and citations toward Google Business Profile and reviews, with a recent pivot back toward behavioral and social signals as Google’s engagement telemetry gets better.
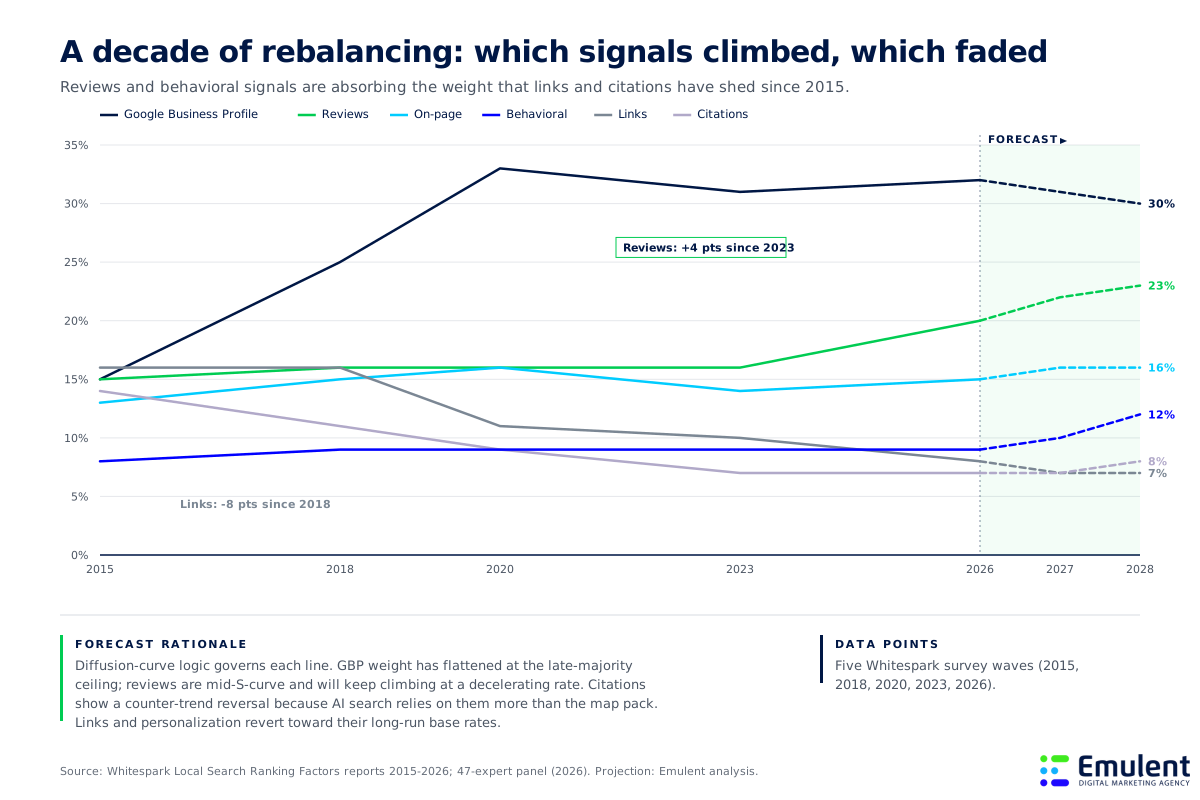
Three storylines run through the chart. First, Google Business Profile influence doubled between 2015 and 2020 and has plateaued near 30% since. That curve looks like a classic Rogers diffusion saturation pattern: easy gains have already been captured, and incremental gains require new product features rather than survey reweighting. Second, reviews kept their position for most of the decade and then jumped four points between 2023 and 2026. That is the most active line on the chart. Third, links and citations have been bleeding share for years.
What the line trajectories tell you:
- GBP nearing its ceiling: Late-majority adoption typically caps shared influence around 30 to 35% of a category. We model a small drift down to 30% by 2028 as other categories take share.
- Reviews mid-S-curve: A four-point gain in three years is fast. Our 2028 projection of 23% assumes the gain decelerates because the panel has limited share to redistribute.
- Citations counter-trend reversal: The category bottomed near 6 to 7% in 2023 and is climbing again because AI Overviews lean heavily on directory mentions for entity verification.
- Links reverting to base rate: Mean reversion logic suggests links settle near 7%. Below that point, Google starts losing too much spam-filtering signal.
- Behavioral climbing: As Google’s click and call telemetry improves, this category absorbs share from harder-to-measure signals.
The historical view is one half of the story. The other half is what happens when the same business gets ranked by an AI system instead of the map pack.
Why does AI search visibility need its own playbook?
The 2026 Whitespark report broke new ground by introducing AI search visibility as its own category. The panel weighted the same eight signals for AI surfaces (ChatGPT, Perplexity, Google AI Overviews) and the rankings inverted in ways that have real budget implications.
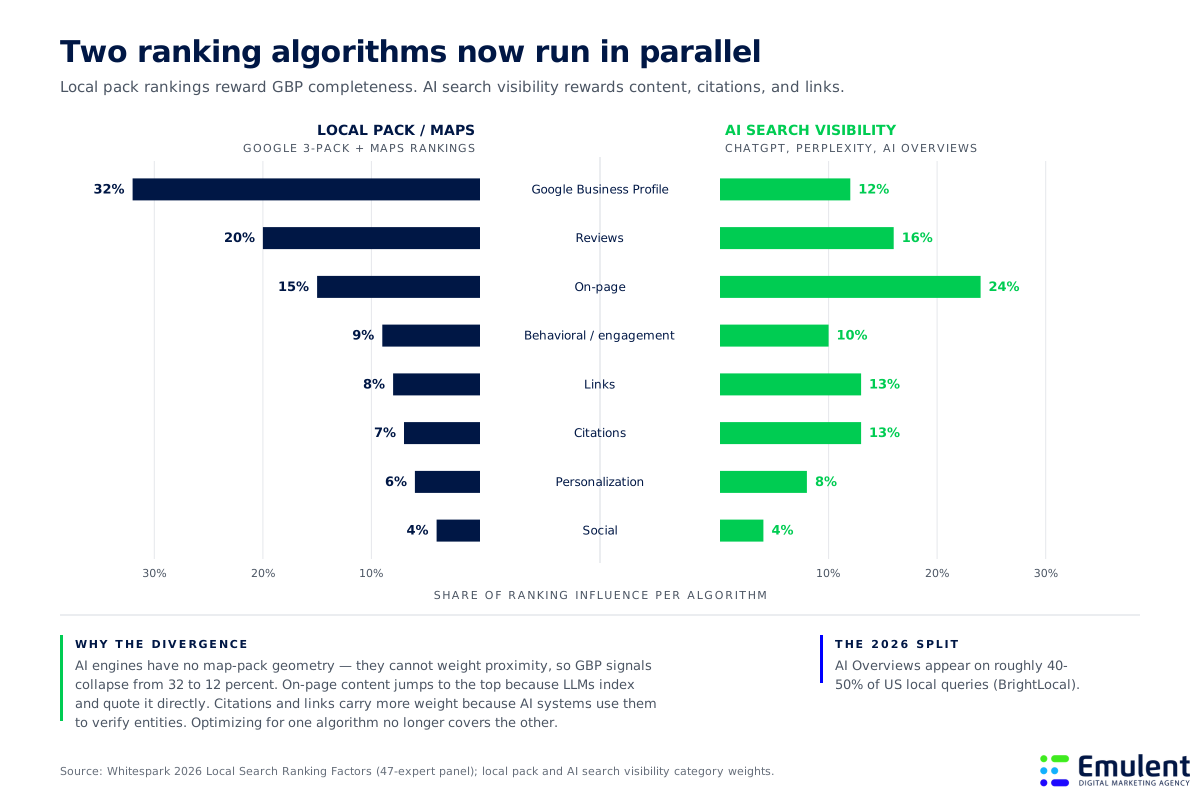
AI engines do not have a map. They cannot weight proximity because they have no geometry to measure distance against. That single fact reshuffles everything. On-page content jumps to the top of the AI ranking because LLMs index and quote it directly. Citations roughly double in weight because AI systems use them to verify that a business exists and is named correctly. Links carry more weight because they help the model assess authority without a Google Business Profile to lean on. The same dynamic explains why Google AI Overviews cite different sources than the local pack does for the same query.
Three implications for budget allocation:
- Local pack work does not transfer cleanly to AI search. Most of the 32% you spend optimizing the profile produces a 12% return on AI surfaces.
- Content depth matters twice. On-page is 15% in the local pack and 24% in AI search. A strong content layer earns visibility in both, while profile work earns visibility in only one.
- Citations are no longer a one-time setup task. AI search ranking benefits from active citation maintenance and listings on niche, vertical-specific directories rather than the standard data aggregators.
If you only optimize for the map pack, you are optimizing for roughly 40% of local-intent traffic. Google’s AI Mode and the standalone AI assistants now field the rest, and they cite different sources for the same query. That is why we treat local SEO and AI SEO services as one connected program rather than two separate workstreams. – Strategy Team, Emulent
One category is climbing fast enough in both rankings to deserve its own section.
What makes reviews the only category still climbing?
Reviews are the standout signal of the 2020s. Where every other category has been holding station or shedding influence, reviews are still moving up. The chart shows the trajectory.
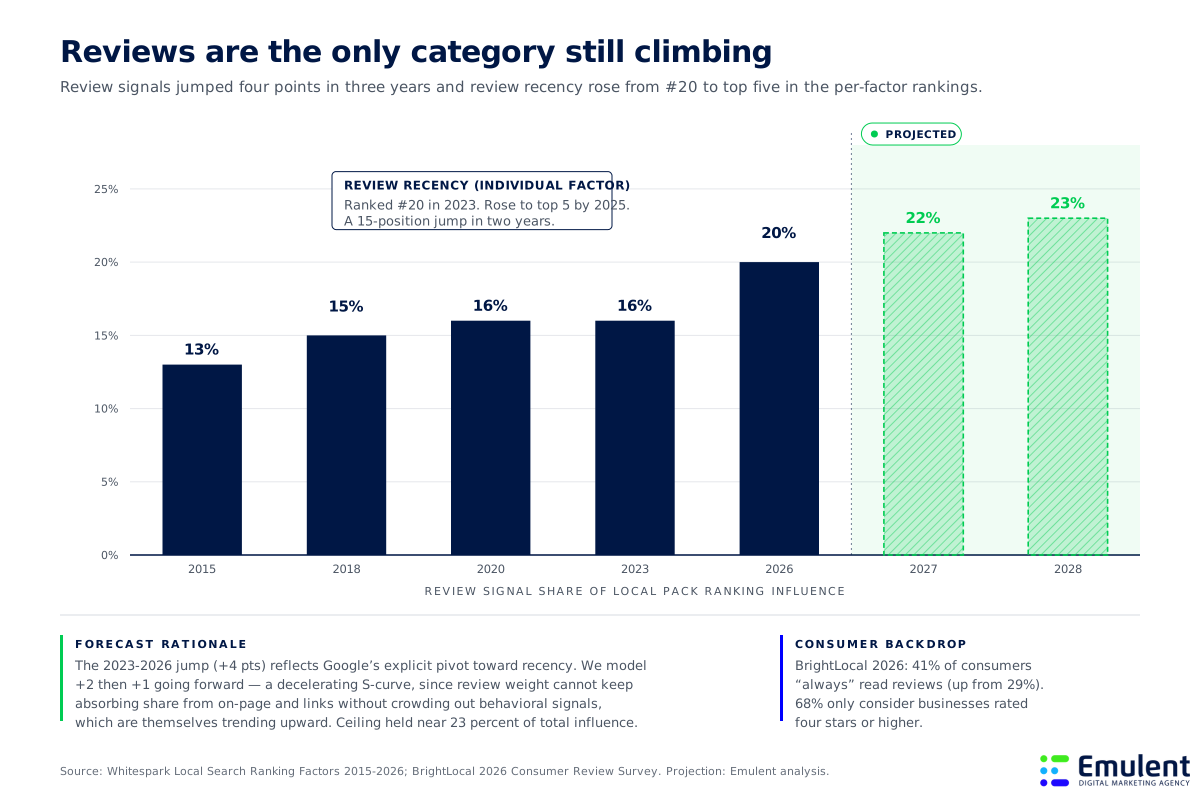
Reviews moved sideways between 2015 and 2023 and then broke out. The four-point gain reflects two underlying changes inside the algorithm. The first change is that recency now carries more weight than volume. A business with 50 reviews where 10 arrived in the last 30 days now outranks a business with 500 reviews that are all more than a year old. The second change is sentiment scoring. Google’s natural language layer reads review text and weighs the substance of recent reviews more heavily.
What this means for review programs:
- Weekly cadence beats quarterly bursts. A steady flow of three to five new reviews per week is worth more than 20 in one month and zero the next.
- Response rate is a ranking input. Businesses responding to 80% or more of reviews see measurable lift, and Google indexes the response text.
- Sentiment matters more than star average. A 4.4 average with detailed, recent reviews can outperform a 4.9 average that has been static for a year.
- Keywords in your responses, not in customer reviews. Sterling Sky’s controlled tests confirmed customer-side keyword stuffing does not move rankings, while response-side keywords do.
The category-level view tells you where weight sits. The factor-level view tells you what to do this quarter.
Which individual factors moved the most between 2023 and 2026?
Beneath the eight categories sit 187 individual factors, and the ranking among those factors has shifted in ways that should change your weekly checklist. Our final chart maps the ten biggest movers.
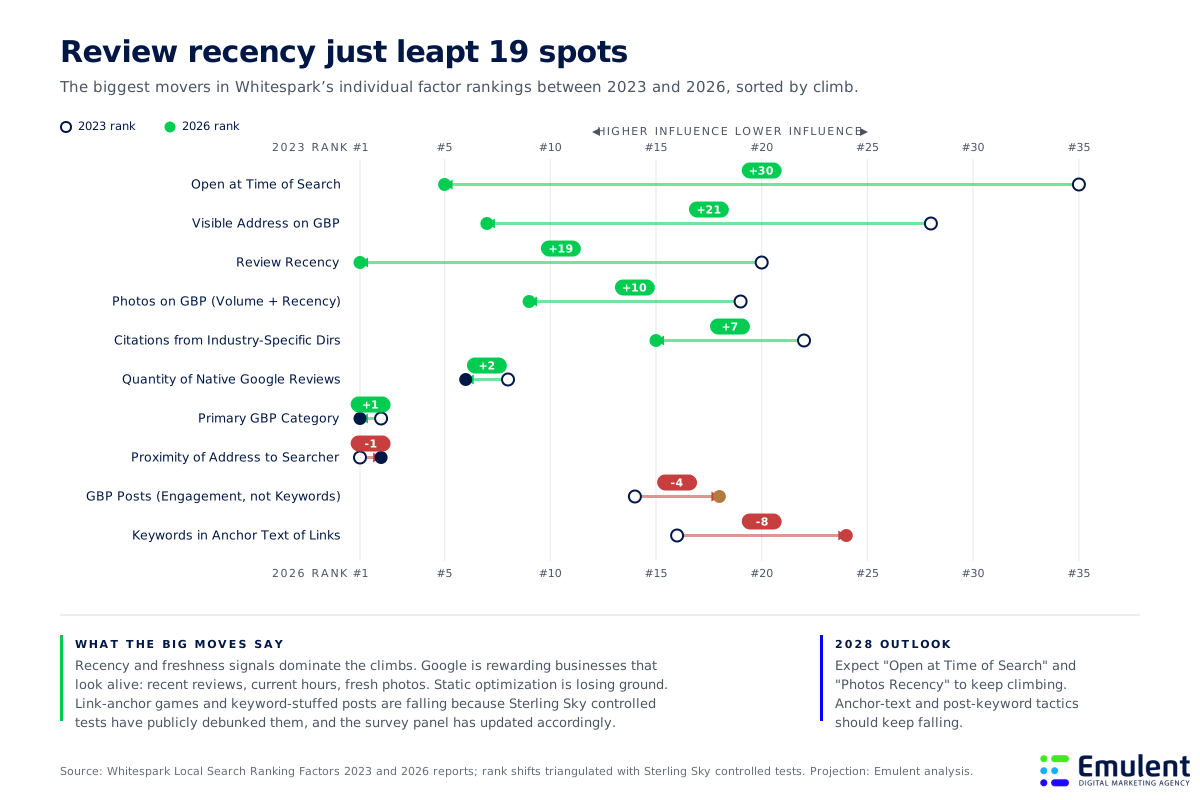
Three of the top four movers describe the same underlying behavior: Google rewards businesses that look alive. Open at time of search, visible address, and review recency all measure freshness rather than configuration. A business that completed its profile in 2022 and has not touched it since is hemorrhaging rank against a competitor running weekly updates, even if the competitor’s profile is less complete on paper.
What the rank shifts tell you to start, stop, and continue:
- Start: tracking business hours accuracy. “Open at time of search” climbing 30 positions means Google now actively filters closed businesses out of the visible pack. Holiday and seasonal hours updates matter.
- Start: weekly photo uploads. Photos volume and recency climbed 10 positions. Stale photo libraries signal a stale business.
- Stop: anchor-text optimization in link building. The factor fell 8 positions because Google’s anti-manipulation systems are now strong enough that the panel sees the effort as wasted.
- Stop: keyword-stuffing Google posts. The factor fell 4 positions after Sterling Sky’s 9-week, 441-keyword study found zero ranking lift.
- Continue: primary category accuracy. The single strongest factor in the entire survey. Wrong category equals invisible regardless of other work.
The list of factors that fell is as instructive as the list that climbed. When a controlled test like Sterling Sky’s keyword study lands publicly, the survey panel updates within the next cycle, and tactics that used to deliver lift stop showing up in our client reports too. We treat the falling list as our stop-doing list. – Strategy Team, Emulent
The five charts together give you a current weighting, a historical curve, an AI overlay, a category deep-dive, and an individual factor breakdown. The last question is how to sequence the work between now and 2028.
How should you sequence the work between now and 2028?
Our forecast bends review signals to 23%, lifts behavioral signals to 12%, and recovers citations to 8%. Those moves are not large in absolute terms, but they are large enough that quarterly priorities should shift. We use a three-horizon plan with clients running through our search everywhere optimization program.
The three-horizon sequence for 2026 through 2028:
- Horizon one (next 90 days): Fix the basics. Verify primary category, confirm business hours including holidays, add a dedicated landing page for each service area, and set up a weekly review request workflow. These are the foundation of any sound local SEO checklist.
- Horizon two (six to twelve months): Move beyond the profile. Build city-specific landing pages with original content, earn citations from industry-vertical directories rather than data aggregators, and start measuring AI search visibility with branded query tracking inside ChatGPT and Perplexity.
- Horizon three (12 to 24 months): Compete on freshness and engagement. Establish a content cadence for posts and photos, build a local link program tied to community events and partnerships, and structure your website data so AI engines can extract and quote it.
Reading the projections without acting on them leaves rank on the table. Acting on the projections without understanding the controlled-test evidence underneath them wastes hours on tactics like anchor-text gaming or post keyword stuffing that the panel has already flagged as flat. The signal categories that pay back are the ones that prove a business is real, local, recent, and engaged.
How Emulent helps you act on this data
We work with local and multi-location businesses to translate ranking factor research into an operating model: a weekly review cadence, a quarterly citation audit, an AI search visibility tracker, and a content calendar aligned to the categories carrying the most weight. Our team has been running this playbook through Google’s Vicinity update, the AI Overviews rollout, and the 2026 Whitespark shifts, and we keep our methodology in lockstep with each new survey wave.
If you would like a second set of eyes on your local SEO program, or if you want to compare your current weighting of effort against the 2026 weighting of influence, contact our digital marketing agency and we will walk through the data together.