
The blended ecommerce benchmark is a vanity number, and budgeting against it costs real money. The “average” conversion rate spans a 5x gap between verticals. The most-quoted CAC figures are agency estimates dressed up as measurements. Ad cost averages mix panels that have nothing in common. We pulled every 2026 benchmark that traces to a real, named, US-relevant source, and the honest picture is a set of spreads, not a set of targets. This report gives you the numbers, where each one came from, and the behavioral mechanism behind where each one is headed. It also tells you which popular numbers we refuse to print, and why.
We hold a published position that ranking #1 is nothing more than a vanity metric, and industry averages earn the same label. A benchmark you cannot trace, date, and match to your own business model is a decoration on a dashboard. The scoreboard is customers and revenue. Everything below is in service of that scoreboard.
The Market: Online Buying Is Growing Again, and It Is Still the Minority
US retail ecommerce hit $326.7 billion in the first quarter of 2026, which is 16.9% of total retail sales, per the U.S. Census Bureau’s May 2026 release. That is 9.8% growth over Q1 2025, the fastest quarterly rate since 2021, against 3.9% growth for retail overall. For the full year 2025, the Census Bureau puts ecommerce at $1.234 trillion and 16.4% of total retail.
Read that second number again. After thirty years of ecommerce, roughly 83 cents of every US retail dollar still changes hands offline. The share was 11.9% just before the pandemic and has added about a point per year since the 2022 correction. The full quarterly series back to 1999 sits in FRED series ECOMPCTSA if you want to check our math.
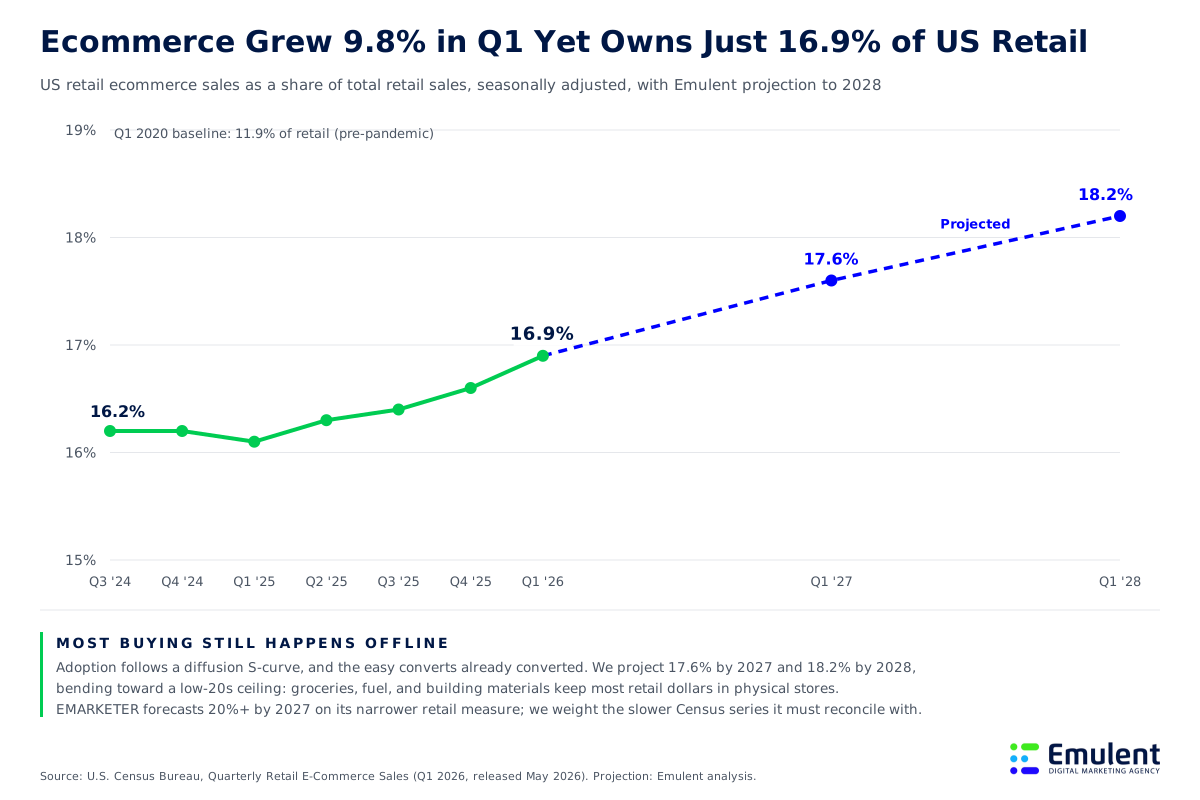
Projection: Emulent analysis based on diffusion-of-innovations S-curve adoption, assuming a low-20s percent ceiling because grocery, fuel, and building-materials spending resists online substitution, cross-checked against EMARKETER’s forecast of 20%+ US penetration by 2027 on its narrower retail measure. We weight the slower Census series.
The strategy consequence: the rising-tide phase is over. A point per year of share gain means your category’s growth now comes mostly from competitors, not from new online dollars. Our study of how retail brands are growing found the winners treat online and offline as one buying experience rather than two channels fighting for credit.
Conversion Rate: The Average Is a 5x Spread Wearing a Trench Coat
There is no such thing as “the” ecommerce conversion rate, and any report that hands you one number is hiding its methodology. The credible 2026 panels disagree by design: IRP Commerce’s live merchant panel reads 1.70%, Littledata’s Shopify panel reads 1.4% (with 3.2% marking the top 20% of stores and 4.7% the top 10%), and Dynamic Yield’s enterprise-weighted panel reads 2.66% globally and 2.96% for the Americas. Different merchants, different denominators, different answers. All of them are correct about their own panel and useless as your target.
The spread between verticals is the number worth acting on. Food and beverage stores convert between 4.5% and 6.1% of sessions. Luxury and jewelry converts between 0.87% and 1.19%. Same year, same panels, a 5x gap.
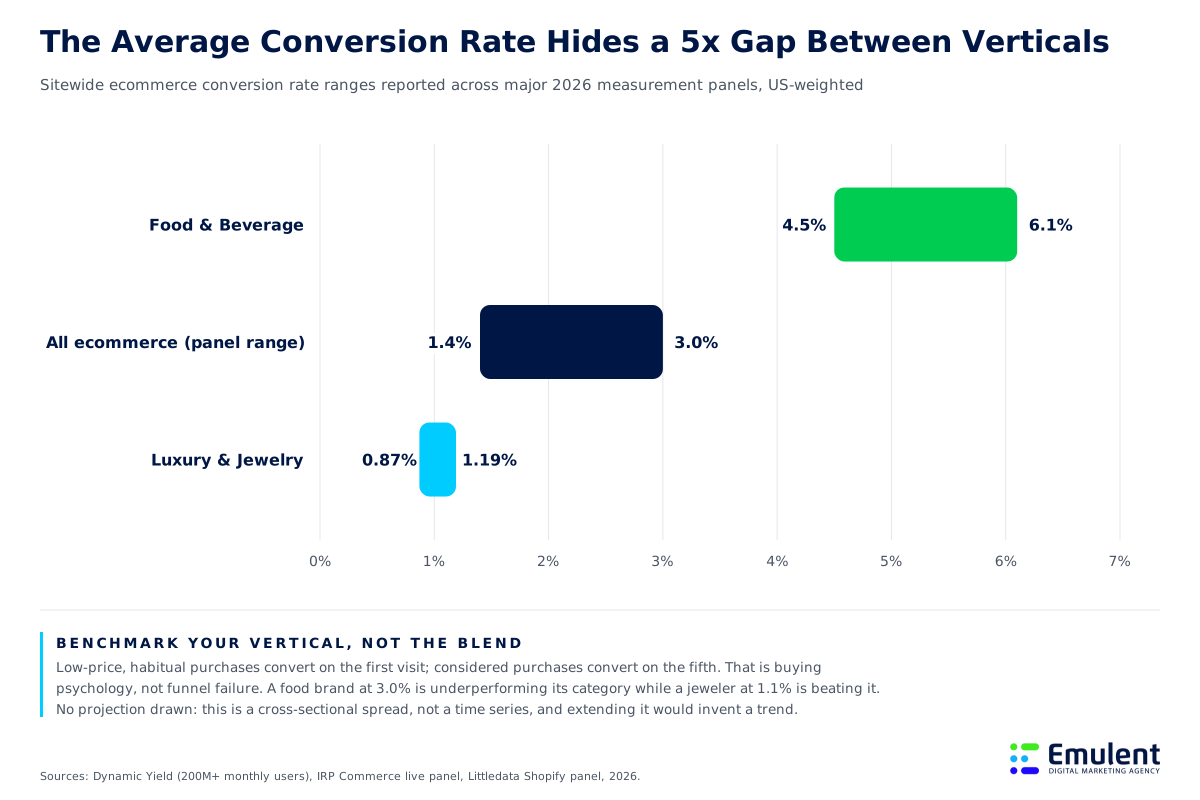
The mechanism is purchase frequency, not funnel quality. A $30 repeat purchase gets decided in one visit. A $3,000 considered purchase gets decided across five visits, three devices, and a conversation with a spouse, so most of those sessions were never going to convert and no checkout fix will change that. Benchmark against your vertical’s range in our average conversion rate by industry data, and if your traffic is high while orders stay flat, the more likely culprit is intent mismatch, which we broke down in why your website gets traffic but doesn’t convert.
One more panel note for store owners: the Shopify-specific figures above are one reason we point ecommerce clients toward Shopify. A platform with a large, measured merchant panel gives you honest peers to compare against, which most custom builds never get.
Cart Abandonment: The Benchmark That Refuses to Move
Seven of every ten carts get abandoned, and that has been true for over a decade. Baymard Institute’s meta-analysis of 50 independent studies puts the average at 70.22%, updated September 2025, with annual readings holding inside a 69% to 71% band since 2014. Better payment tech, one-click checkout, wallets on every phone: none of it moved the number.
The plateau is behavioral. Baymard’s research shows 43% of abandoners were only browsing, which is window shopping and always will be. Of the rest, 48% quit when fees appeared at checkout that were not visible before, which is loss aversion doing exactly what loss aversion does: a surprise $9 shipping charge feels like a $9 theft, not a $9 price.
So stop trying to beat the 70% average and start attacking the fixable share. Show total cost, shipping included, before the checkout page. Baymard’s testing across large US retailers puts the conversion upside of fixing documented checkout usability problems at 35.26%, which is worth more than most brands’ entire ad-testing budget for the year.
The abandonment average is the least useful number in ecommerce. Forty-three percent of those people were never buying. Chase the 48% who flinched at a surprise fee. That one is yours to fix by Friday. - The Strategy Team at Emulent
Ad Costs: The Auction Is the Benchmark Moving Fastest
Every paid channel got more expensive in 2025, and the platforms’ own measured panels show it plainly. Triple Whale’s panel of roughly 35,000 ecommerce brands puts the median Meta CPM at $13.48 for 2025, up about 20% year over year, with a median CPA of $38.17 and a median return on ad spend of 1.93x. Its Google panel of 18,000+ brands measured an average CPM of $12.79, up 10% year over year. And Amazon’s ad auction saw CPM jump 47.46% in a single year, the sharpest cost increase of any channel in the dataset.
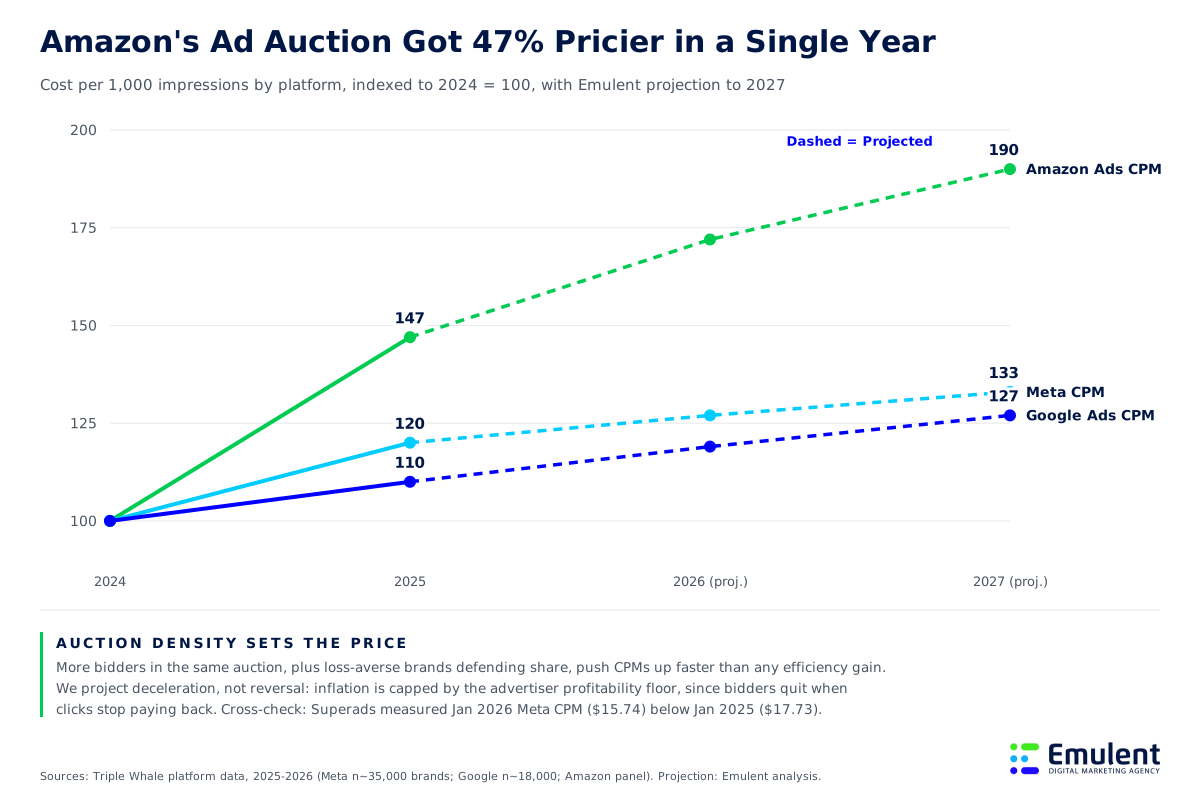
Projection: Emulent analysis based on auction density amplified by loss-averse defensive spending, assuming CPM inflation decelerates at the advertiser profitability floor because marginal bidders exit when acquisition stops paying back, cross-checked against Superads’ $3 billion spend tracker showing January 2026 Meta CPM ($15.74) below January 2025 ($17.73).
Note the ROAS detail inside the Meta numbers, because it is a small lesson in benchmark honesty. The median brand earns 1.93x. The average account earns 2.98x. The average is dragged up by a few outliers, and every vendor selling you ads will quote you the average. Anchor on the median. For the wider channel picture, our social media advertising trends report tracks how spend is shifting between these auctions.
One number we will not print: the widely quoted “$5.42 average Google Ads CPC.” It traces to a marketing-services company’s client panel, meaning a competitor’s book of accounts, unverifiable and unrepresentative of ecommerce stores. A benchmark whose panel you cannot inspect is a rumor with a decimal point.
When a founder shows us a benchmark table, we ask one question first: whose accounts are in the panel? Nine times out of ten, nobody knows. You would never accept a lab result without asking who ran the lab. - The Strategy Team at Emulent
The Q4 Tax: Plan for a 26% Premium
Holiday quarters carry a measurable surcharge. Affect Group’s analysis of US Meta CPMs found Q4 2025 averaged $25.49, which ran 22% above Q1, 15% above Q3, and 26% above the annual average. Superads’ tracker of $3 billion in spend saw the global median peak at $25.22 in November before resetting to a 13-month low in January.
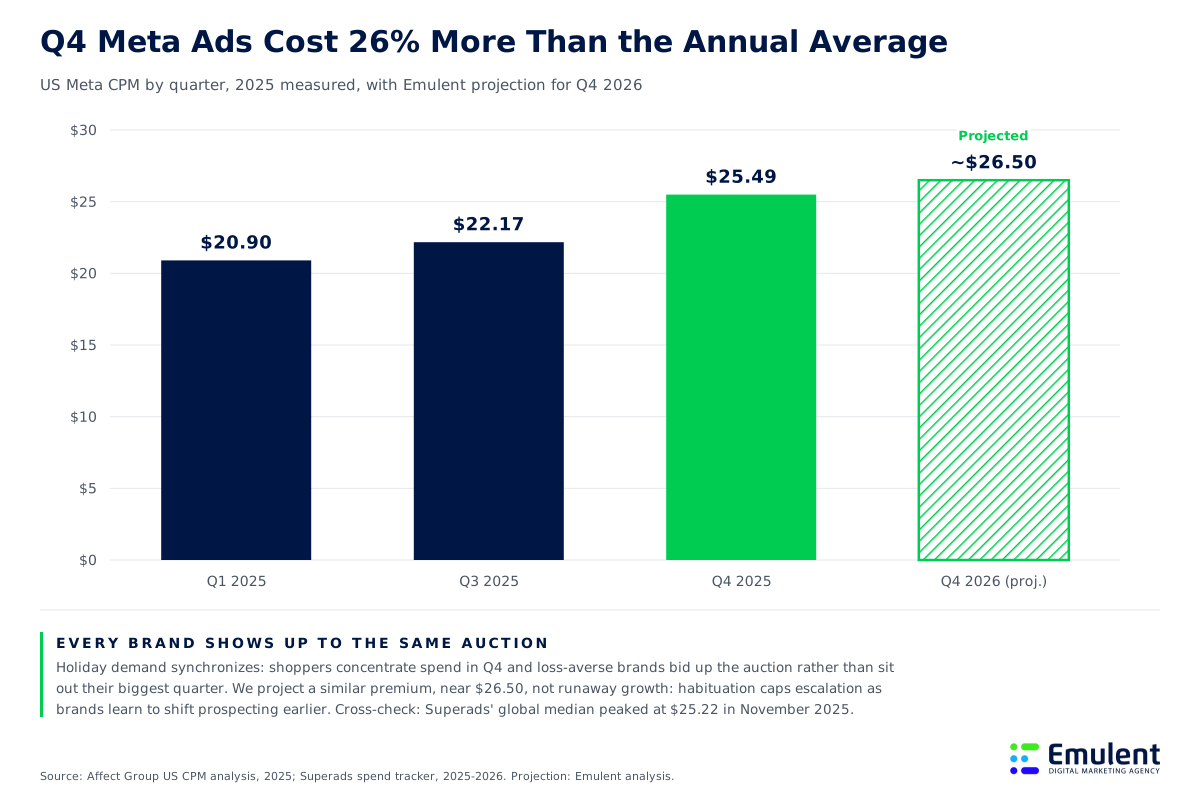
Projection: Emulent analysis based on synchronized holiday demand plus loss aversion (brands overbid rather than sit out their biggest quarter), assuming the premium stabilizes near 25% over baseline because habituation and earlier prospecting flatten the spike, cross-checked against Superads’ November 2025 peak of $25.22.
The planning move is simple and most brands skip it: build audiences in September and October when impressions are cheap, then spend Q4 dollars converting warm traffic instead of paying peak prices for cold reach. Paying the November auction to introduce yourself is the most expensive introduction in marketing.
Amazon: Better Returns, Steeper Cover Charge
Amazon advertising in 2026 is a paradox worth sitting with. Per Triple Whale’s panel, CPA fell 5.65% to $13.35, conversion rate rose 9.97% to 11.02%, and ROAS climbed 10.16% to 3.14x, all while the cost of entering the auction jumped 47%. Shoppers arrive ready to buy, so conversion strength has outrun cost inflation so far.
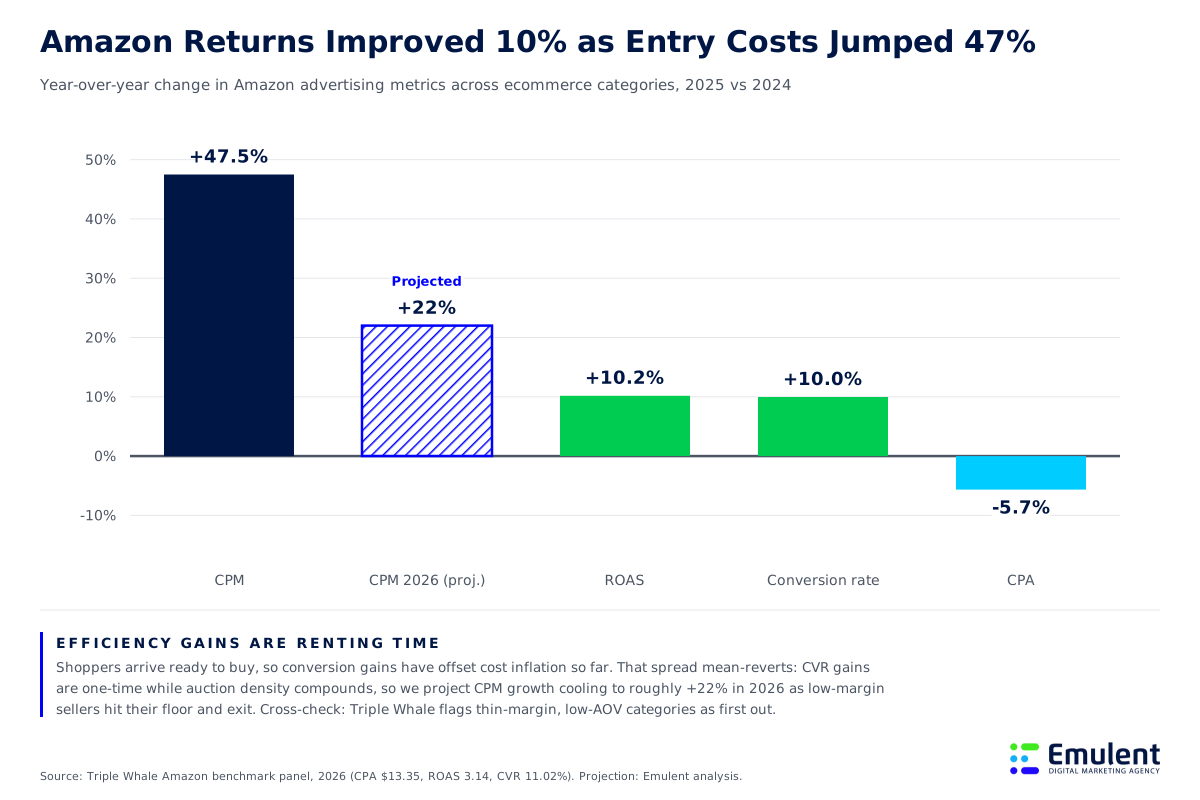
Projection: Emulent analysis based on mean reversion, assuming CPM growth cools toward the rate thin-margin sellers can bear before exiting the auction because conversion gains are one-time while auction density compounds, cross-checked against Triple Whale’s own flag that low-order-value categories face the thinnest margin for error.
Our position: the current spread will not hold, so treat 2026 Amazon efficiency as a window, not a baseline. Conversion rates cannot rise 10% a year forever; auction entry costs can compound far longer. Brands with strong listings and real margin should press the advantage now. Brands under roughly $40 in order value should model next year’s CPM before adding budget, because they are the first ones the math pushes out.
CAC and CPL: The Benchmarks Most Likely to Be Made Up
Here is the uncomfortable finding from this research pass: almost every specific ecommerce CAC dollar figure in circulation fails a citation trace. The “$70 average CAC” and its cousins bounce between agency blogs citing each other, with the original study unnamed. That is a zombie stat, and repetition is not evidence. What does hold up is the direction: acquisition costs have risen sharply for five straight years, and the platform-measured CPM inflation above is the mechanism, since CAC is downstream of what the auction charges and what your site converts. Our customer acquisition cost benchmarks report tracks the figures that do survive tracing.
For ecommerce, cost per lead is mostly the wrong lens anyway. Stores run on cost per acquisition, and the measured 2026 medians are $38.17 on Meta, $13.35 on Amazon, and $32.74 on TikTok, all from Triple Whale’s platform panels. If you run lead capture ahead of a considered purchase, benchmark against our average cost per lead data instead of ecommerce CPA tables, because the two funnels price differently.
The number that decides whether any CPA is good belongs to you, not a panel: contribution margin per order and repeat rate. A $38 CPA is a bargain for a 60%-margin brand whose customers reorder quarterly and a slow bleed for a 25%-margin brand selling one-time purchases. Pair your CPA against our customer lifetime value benchmarks and the common 3:1 LTV-to-CAC floor becomes a floor you can actually compute rather than a slogan.
Averages feel safe because comparison feels like knowledge. Anchoring on a blended CAC lets a founder skip the harder math on their own margins, and the auction will happily charge them for skipping it. - Bill Ross, Founder of Emulent
How to Benchmark Your Own Store in One Afternoon
Run this before you touch a budget. Each step has a threshold, and the thresholds come from the sourced data above, not from wishes.
- Compute contribution margin per order. Revenue minus product cost, shipping, payment fees, and returns. If you cannot produce this number, stop buying traffic until you can. It is your bid ceiling, and no agency, ours included, should be scaling your spend without it.
- Place your conversion rate inside your vertical’s range, not the blend. Food and beverage below 4.5%, or luxury below 0.87%, signals a real problem. Luxury at 1.1% does not, whatever the blended average implies.
- Check the surprise-cost failure first. If total cost with shipping is not visible before checkout, you are donating a share of the 48% who abandon over exactly that.
- Compare your CPM to the platform medians, not your CPA to a stranger’s. Meta near $13.48 and rising, Amazon rising fastest, both spiking about 26% in Q4. Costs 2x the median mean a targeting or creative problem; costs near the median with a bad CPA mean a site problem.
- Score your organic base. Paid costs compound yearly; owned traffic does not. Run our ecommerce SEO checklist against your store before deciding the paid budget, because every organic order lowers your blended acquisition cost.
If you want this done against your real competitors rather than industry panels, that is precisely what our competitive audit and research work exists for, and it feeds the rest of our digital marketing services when the audit finds something worth fixing. No long-term contract either way. The findings should keep you, not the paperwork.
The Honest Scoreboard
The blended benchmark is a vanity number, and this report should prove it by its own contents: the conversion “average” splits 5x by vertical, the abandonment “average” is 43% window shoppers, the ROAS “average” runs a full point above the median, and the most-repeated CAC figures cannot be traced to anyone who measured anything. The numbers worth keeping are the spreads, the medians, the platform-measured costs, and above all your own contribution margin per order. Benchmark against those, revisit them quarterly as the auctions reprice, and let the industry keep decorating its dashboards with averages. Our full library of marketing benchmark reports is maintained on the same rule: if we cannot trace it, we do not print it.