
Marketing strategy opportunities are found by running specific analyses, and each analysis answers exactly one strategic question. Reputation analysis tells you where competitors are failing customers. Channel analysis tells you where buyers actually research. Visibility gap analysis tells you which table-stakes assets your market skipped. Audience analysis tells you who to target and where. Benchmark analysis tells you what winning should cost. Most local businesses run none of these before setting strategy; they copy the loudest competitor and adjust by feel. This guide walks through the five analyses, the current data behind each, and the filter that turns what you find into a strategy with a budget attached.
Tie Every Analysis to a Strategy Decision First
An analysis without a named decision is a hobby. Before you open a spreadsheet, write one sentence in this form: “This analysis will decide whether we ______.” The blank should hold a real marketing choice with money attached, on the pattern of:
- Whether the next $2,000 a month goes to paid ads, reputation work, or content, based on where the biggest measured gap sits.
- Whether to reposition around a service or specialty competitors handle badly, or keep competing head-on and win on execution.
- Whether to extend the campaign into a new channel your buyers have moved to, or double down where you already convert.
- Whether to target a new neighborhood, customer segment, or price tier, or spend deeper on the ones already producing revenue.
The sentence matters because it defines what counts as an answer and, just as important, what you are allowed to ignore. Half of what any research project turns up is interesting and useless, and without the sentence you will drown in it. It also keeps the scoreboard honest: the output of marketing research is a change in where customers and revenue come from, and rankings reports or follower counts are decorations. We have written before about why ranking #1 is nothing more than a vanity metric, and the same logic binds every analysis below. Refuse any research plan that cannot tell you, in advance, what finding would change your mind.
Reputation Analysis: Mine the Review Layer for Positioning Gaps
Here is the position most guides will not take: your competitors’ review profiles are a better first research source than any demographic report, and their negative reviews are the single highest-yield document in your market. A one-star review is a customer telling the whole market what they wanted, what they paid, and where the incumbent failed them, with names, dates, and dollar figures attached. Fifty of them, read in one sitting, form a map of unmet local demand that no purchased dataset can match. Demographic data tells you who lives in your zip code. The review record tells you what they are angry about, and anger is where positioning opportunities live.
“Your competitors’ one-star reviews are the cheapest market research you will ever run. Read fifty of them before you spend a dollar on a survey. Nobody lies in a complaint, and nobody writes a 400-word complaint about something they didn’t care about.” – The Strategy Team at Emulent
Run the analysis as a two-hour audit, in this order:
- Pull the ten closest direct competitors. Closest by what your buyer sees, so the businesses that show up for your money searches and in the map results, whether or not you consider them peers.
- Record four numbers for each one. Review count, average rating, review velocity over the last 90 days, and whether the owner responds. This is the scoreboard the rest of the audit reads against.
- Read every review of 3 stars or below from the past two years. Tag each complaint as you go: waited too long, surprise pricing, rude staff, poor communication, no availability.
- Hunt for tags that repeat across businesses. When one complaint shows up at three or more competitors, you have found a market-level failure, and a market-level failure is a positioning opportunity, especially valuable if you are working out how to stand apart when marketing in a saturated market.
- Turn the winning tags into search language. Buyers search for solutions in the words of their complaints, so the repeated tags become the seed list for keyword research, messaging, and offers.
The same analysis tells you whether reputation itself is the strategy. In the 2026 BrightLocal Local Consumer Review Survey of 1,002 US consumers, 68 percent said they will only consider a business rated 4.0 stars or higher, up from 55 percent a year earlier, and the share demanding 4.5 or higher nearly doubled, from 17 to 31 percent. Those are stated thresholds from a survey, not observed purchases, but the direction is steep and consistent: 41 percent of consumers now say they always read reviews before choosing a business, up from 29 percent in 2025. So we will commit to a threshold of our own. If any direct competitor holds 4.5 stars with 100 or more reviews and you sit below 4.0, reputation is your marketing strategy for the next two quarters, and ad spend before that fix is money spent sending buyers to a page that talks them out of you.
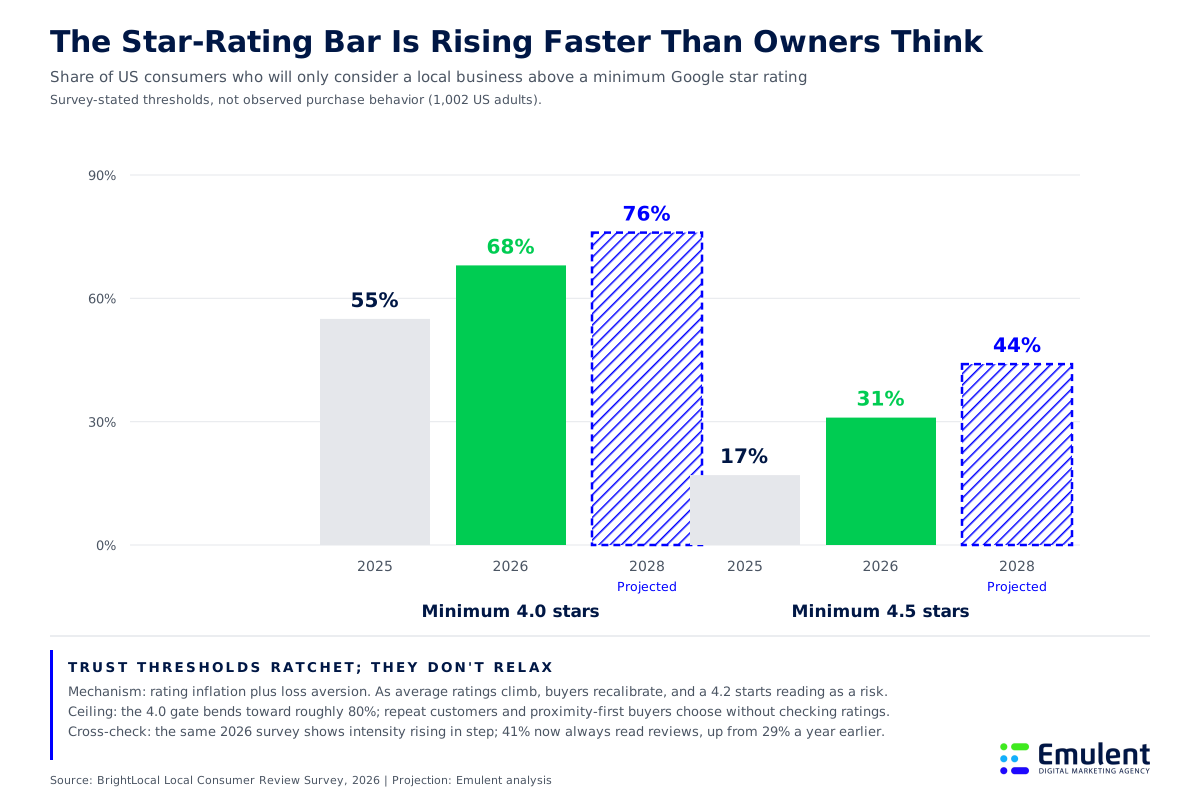
Projection: Emulent analysis based on trust-threshold recalibration under rating inflation, assuming the 4.0-star gate saturates near 80 percent because repeat and proximity-first buyers never consult ratings, cross-checked against the same BrightLocal 2026 series showing review-reading intensity rising from 29 to 41 percent in one year.
The mechanism behind that chart is worth naming, because it tells you the trend will not reverse. As average ratings inflate, buyers recalibrate what “good” means, and loss aversion does the rest: a 4.2 reads as a risk, and buyers avoid risk harder than they chase quality. Trust thresholds ratchet. They do not relax.
Channel Analysis: Map Where Local Buyers Research Now
Channel analysis answers one question: on which platforms will our next customer find and vet us? The 2026 data says the ground moved. Google remains the most-used platform for finding local business reviews, but its share fell from 83 to 71 percent in a single year, while Apple Maps nearly doubled from 14 to 27 percent and local news sites fell from 48 to 29 percent. Your buyers did not stop researching. They scattered. A channel analysis that checks only Google rankings now measures a shrinking slice of the decision, which is why our state of local SEO report tracks visibility across maps, review platforms, and AI answers as one picture rather than one ranking column.
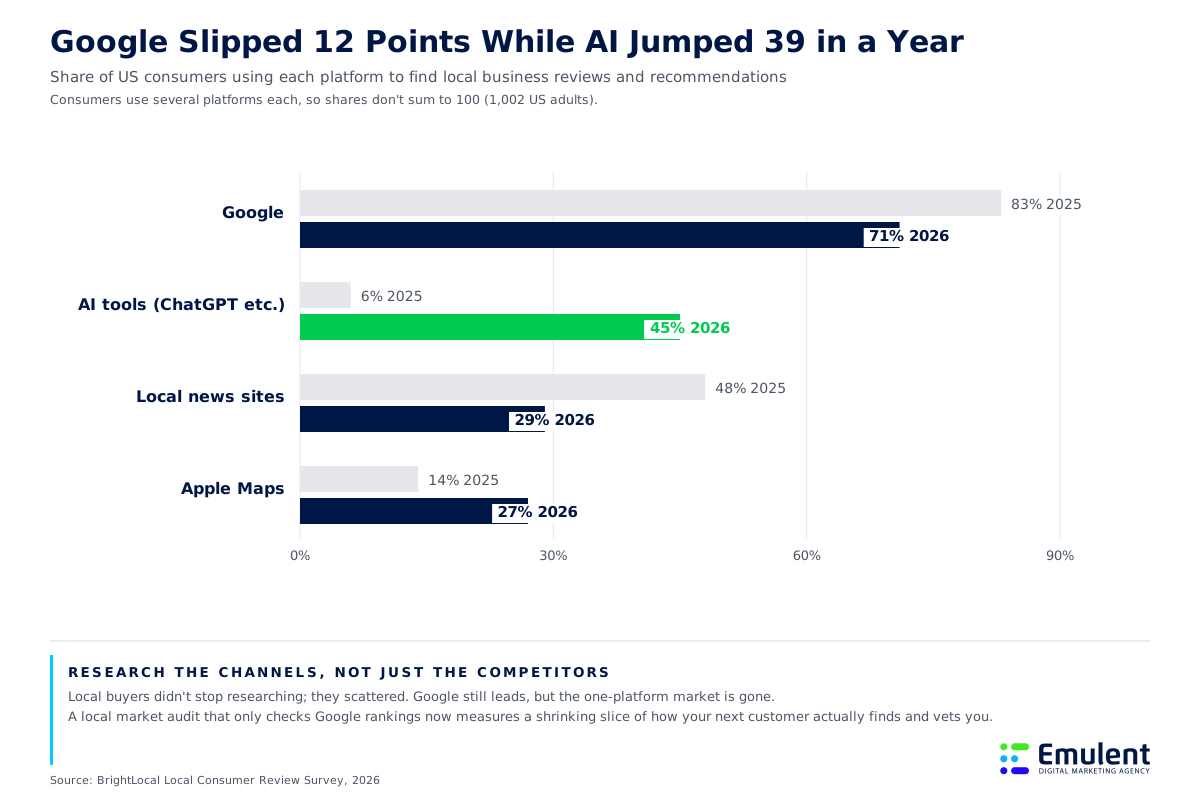
The number that should reset your channel strategy is the AI line. The share of US consumers who used AI tools such as ChatGPT, Gemini, or Perplexity for local business recommendations jumped from 6 percent in the 2025 survey to 45 percent in 2026, making AI the third most-used discovery channel behind only Google and Facebook. And these are not blind believers: BrightLocal’s companion AI research found 88 percent of AI users fact-check the recommendation, usually by reading real reviews. The practical analysis takes an afternoon. Ask the AI tools the questions your customers would ask (“best emergency plumber near me,” “family dentist taking new patients”) and record who gets named and which sources get cited. That is a competitive dataset that did not exist three years ago, most of your competitors have never looked at it, and your review profile feeds it, a loop we unpack in how reviews affect AI search.
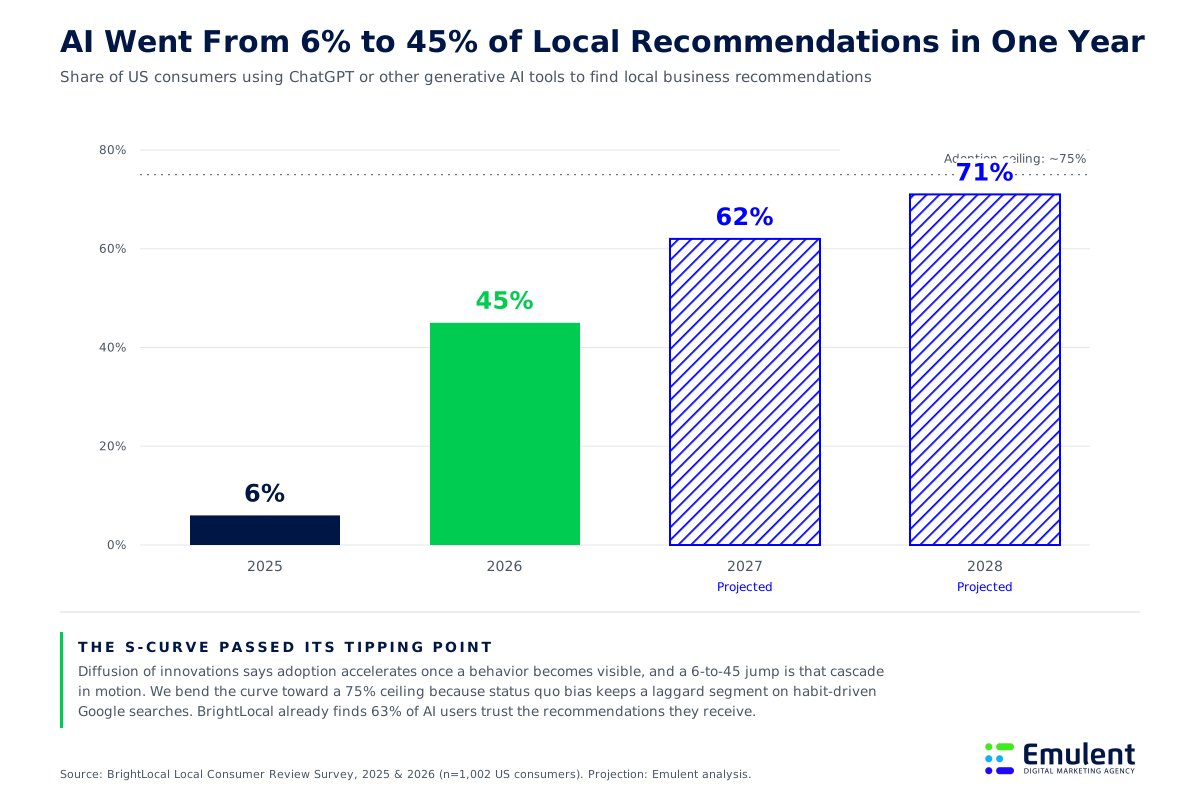
Projection: Emulent analysis based on diffusion of innovations, assuming a 70 to 75 percent ceiling because a share of local lookups remain habitual map checks and a laggard segment never adopts a conversational step, cross-checked against Gartner’s 2024 forecast of a 25 percent drop in traditional search engine volume by 2026.
Why project continued growth instead of a fad that fades? Because adoption here runs on diffusion rather than persuasion. Nobody has to be convinced to use AI answers once they sit inside the default search box and the default map; the effort cost of trying them falls to zero, and social proof compounds from there. The curve bends below full adoption because a large share of local lookups are habitual navigational checks, hours, directions, the phone number, that never need a conversation. Old habits still carry weight in the analysis too: 46 percent of consumers say they always or often add “near me” to their searches, per BrightLocal’s 2025 Consumer Search Behavior study, and one in five run local searches directly inside a maps app, which is exactly the visibility our local maps SEO services exist to win.
Visibility Gap Analysis: Score the Basics Before the Clever Ideas
Visibility gap analysis compares what each competitor has built against what the channel data says buyers check, and in most local markets it produces the cheapest opportunity on the list. BrightLocal’s 2025 SMB Marketing Report, a survey of US small business owners and managers, found that 89 percent say they invest in organic SEO, yet only 40 percent have a dedicated business website and just 35 percent have a Google Business Profile. Read that again: roughly two-thirds of your potential competitors are absent from the single most-checked local surface, while paying for visibility somewhere. The mechanism is a knowledge gap, and the report points at its source: 54 percent of owners handle marketing entirely alone.
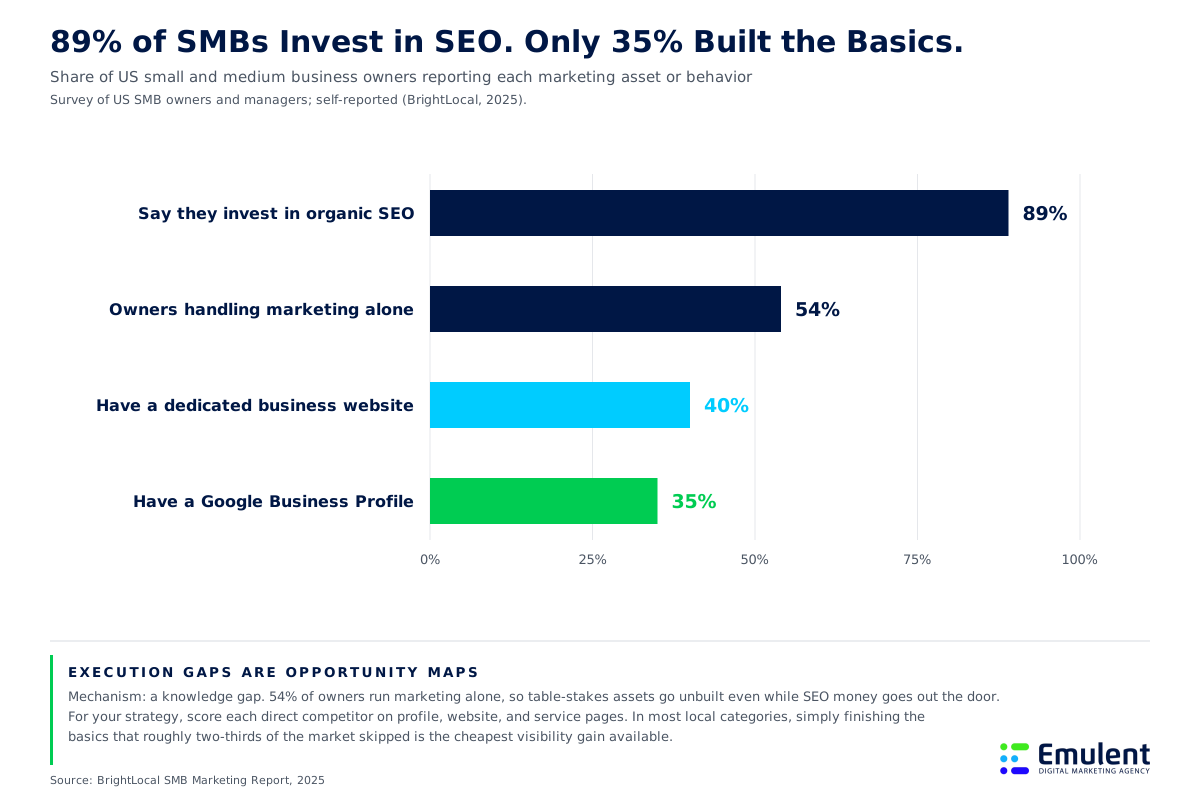
The analysis itself is a scorecard. For each of the ten competitors from your reputation audit, mark yes or no on five assets: a claimed and complete business profile, a dedicated website, a page for each core service, photos added in the last 90 days, and consistent name-address-phone details across the major directories. Then score yourself on the same sheet. Wherever your column beats most of the market, you have found an advantage worth pressing in messaging and spend; wherever it trails, you have found the first line of the strategy. The weighting for what matters most on that scorecard comes straight from the current local SEO ranking factors, and our position is blunt: in most local categories, the fastest strategy win is finishing the basics two-thirds of the market skipped, and it costs execution hours rather than media dollars.
Audience Analysis: Free Federal Data Answers the Targeting Questions
Audience analysis decides who the strategy speaks to, where it runs, and what price positioning the market supports, and free federal data answers those questions with counts instead of hunches. It is dramatically underused because it looks intimidating. It is not. Three sources cover most local targeting decisions:
- American Community Survey (Census Bureau). Household income, age, commute, and housing detail down to the census-tract level. This settles “how many of our target customers live within a 15-minute drive” and tells you which neighborhoods justify geo-targeted ad spend and which do not.
- County Business Patterns and Business Dynamics Statistics (Census Bureau). How many establishments in your category operate in your county and how that count is trending, which tells you whether your positioning fights a crowding market or an emptying one.
- Quarterly Census of Employment and Wages (BLS). Local wage levels, useful for pricing strategy and for judging whether a premium-tier offer has an audience that can afford it.
Two hours in those tables produces the sentence every strategy needs: “There are X households matching our buyer within our service area, served by Y competitors, and the count of competitors grew or shrank by Z last year.” That sentence turns targeting from an opinion into an allocation. A messaging gap the review analysis surfaced only becomes a campaign if the households exist to hear it and the math of reaching them leaves margin behind.
Benchmark Analysis: Price the Strategy Against the Market
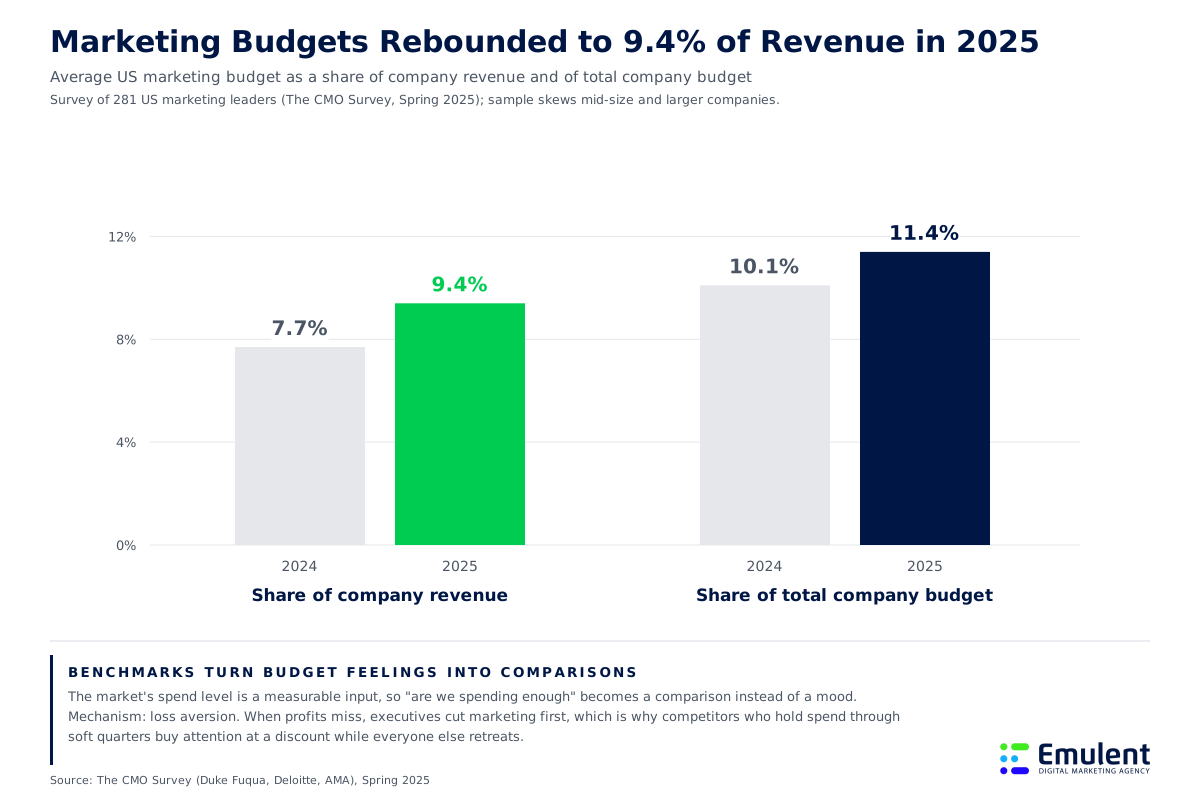
Benchmark analysis answers the question owners argue about most, which is whether the marketing budget is too small, too large, or pointed at the wrong things, and it replaces the argument with comparisons. Start with the market’s spend level. The CMO Survey from Duke’s Fuqua School of Business, Deloitte, and the American Marketing Association, which polled 281 US marketing leaders in early 2025, found marketing budgets rebounded to 9.4 percent of company revenue, up from 7.7 percent in 2024, and to 11.4 percent of total company budgets. The sample skews toward mid-size and larger companies, so treat the figure as a directional benchmark rather than a rule for a five-person shop, but the direction matters: the market as a whole is re-arming, and a competitor holding spend while you cut buys attention at a discount.
Then benchmark the unit costs your strategy assumes. Before committing budget to a channel, check what a lead should cost in your category against our cost per lead by industry data, and check what share of visitors should become inquiries against the average conversion rate by industry. A strategy whose numbers assume you will beat both benchmarks by half in year one is a wish with a spreadsheet. For setting the overall envelope, our marketing budget benchmarks break the spend question down by company size and industry so you can locate yourself before deciding where to move.
Run Every Opportunity Through a Filter That Says No
Research earns its cost at the moment it kills something. Run every candidate opportunity the five analyses surface through four gates, in order, and stop at the first one it fails:
- Demand. Did it show up unprompted in the review record or the search data, or did we go looking for confirmation of an idea we already loved?
- Supply. Can we name the competitors serving it today and point to the specific complaint pattern or visibility gap that proves they serve it badly?
- Economics. Do the audience counts and the cost and conversion benchmarks support acquiring these customers at a margin?
- Credibility. Can we win it with the reputation and proof we have right now, or does the review-threshold data say we fix trust first?
An opportunity that clears all four becomes a strategy line with a budget. Anything that clears three or fewer gets written down and shelved, not “kept in mind.” If what survives the gates is a positioning problem rather than a channel problem, start by answering the question we pose in can you explain why someone should choose your business, because no channel fixes an answer you don’t have.
“Most owners research their market to confirm a decision they already made. Real research costs you something: a service you kill, a neighborhood you stop chasing, an ad budget you cut in half. If your research never tells you no, you did opinion collection, not research.” – Bill Ross, Founder of Emulent
The full version of this process, reputation analysis, channel mapping across Google, maps, and AI answers, the visibility scorecard, federal audience data, and benchmark pricing, is what our competitive audit and research engagements deliver, and we hand over every dataset so you can rerun it without us next year. That is deliberate. We would rather you re-hire us because the research made you money than because a contract said you had to. Either way, start with the two-hour reputation audit this week. Your market has been writing down its unmet demand, one complaint at a time, and the first business in town to read it usually gets to keep what it finds.