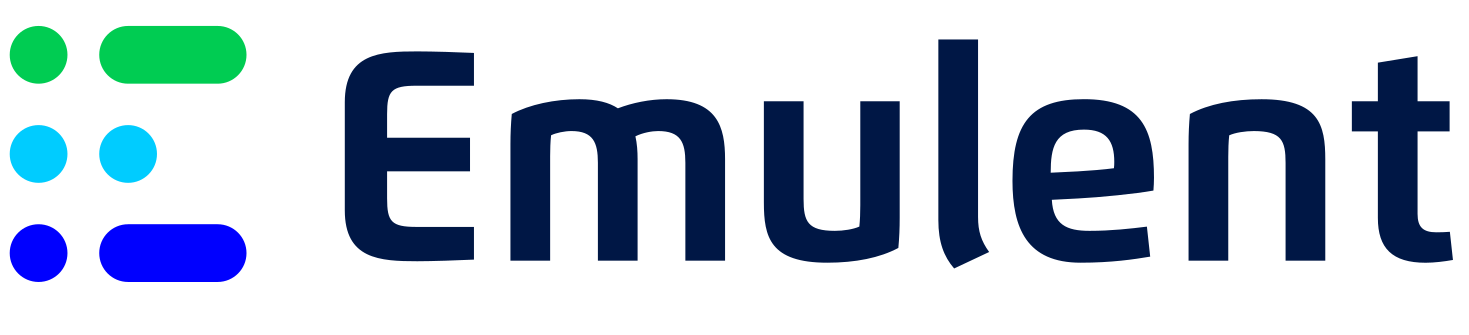
Author: Bill Ross | Published: April 20, 2026 | Updated: May 24, 2026 Key Takeaways: The MM+M/Inmar Healthcare Marketers Trend Report puts the overall U.S. healthcare marketing and communications market at $26.52 billion in 2026, up from $24.55 billion in 2025. Drilling into media spend specifically, healthcare and pharma digital advertising reached $24.8 billion in 2025 and is forecast at $26.2 billion in 2026, with traditional channels weighing in at $6.9 billion. The trajectory points to roughly $29.2 billion in U.S. digital healthcare ad spend by 2028. This is not a story about budgets disappearing. It is a story about where budgets relocate. Digital overtook linear TV inside healthcare back in 2021, and the gap widens every year. Social media spending alone surpassed linear TV in healthcare and pharma in 2025, which would have sounded preposterous to a 2019 pharma media buyer. Three forces shaping the projection:
“The teams that win the next two years are not the ones with the biggest budgets. They are the ones whose attribution actually answers the question, ‘which campaign produced this completed appointment.'” – Emulent Strategy Team
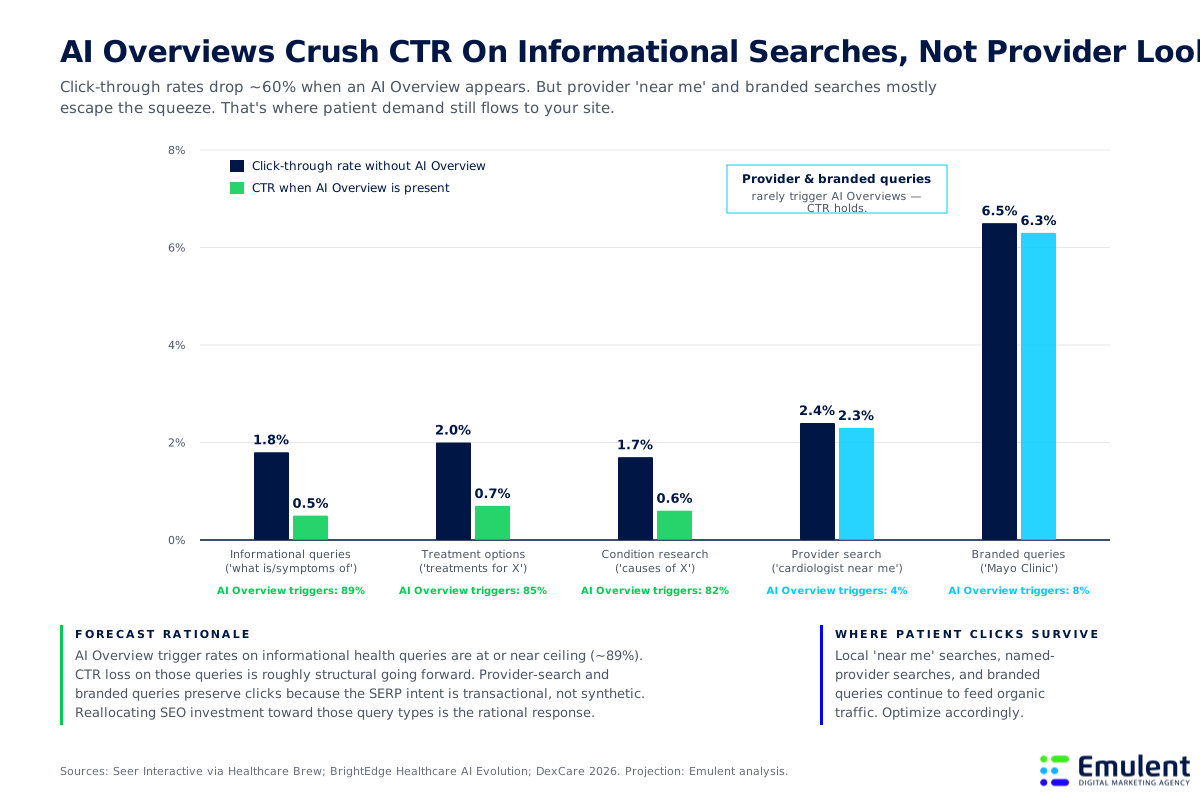
The channels you funded in 2022 will not be the channels you fund in 2028. Digital has already won the headline fight. The interesting question now is which channels inside digital, and which content formats, earn the share leaving linear TV. The next chart explains why even inside digital, search behavior is changing fast enough to invalidate last year’s plan. Zero-click search is no longer a slow drift. It is the dominant outcome. Similarweb data shows the zero-click rate across all Google queries jumped from 56% to 69% between May 2024 and May 2025. Healthcare runs higher than every other sector: BrightEdge analysis shows AI Overviews now appear on 89% of healthcare-related queries, and the healthcare zero-click rate sits at 83% in 2026. Our projection extends that curve to roughly 88% by 2028 as it approaches its logistic ceiling. Two behavioral patterns drive the shift. First, healthcare queries skew informational (“what is X,” “symptoms of Y,” “recovery time for Z”), which is exactly the query type AI Overviews are best at summarizing without sending traffic. Second, patients increasingly trust those AI summaries: 31% of users say AI Overviews “often” or “always” deliver the information they need, and ChatGPT receives more than 230 million health-related questions per week. The behavior is rewarded, so it compounds. What zero-click changes for hospital and practice websites: The strategic shift is uncomfortable but clear. Healthcare teams need to optimize for two things at once: what AI cites, and what patients still click on directly. Which segments of search still produce clicks is the next chart. Not every query type has been hit equally by AI Overviews. Seer Interactive data shows healthcare click-through rates drop from 1.6% to 0.6% when an AI Overview appears, a 61% reduction. But the more useful number sits underneath the headline: AI Overviews almost never appear on transactional, geographic, or branded healthcare searches. Patients searching “cardiologist near me,” “best dermatologist in Atlanta,” or “Mayo Clinic appointment” still see a traditional SERP and still click through at normal rates.
“Clinician-authored, locally optimized content does not just rank better. It survives the AI Overview entirely because the query intent itself is transactional.” – Emulent Strategy Team
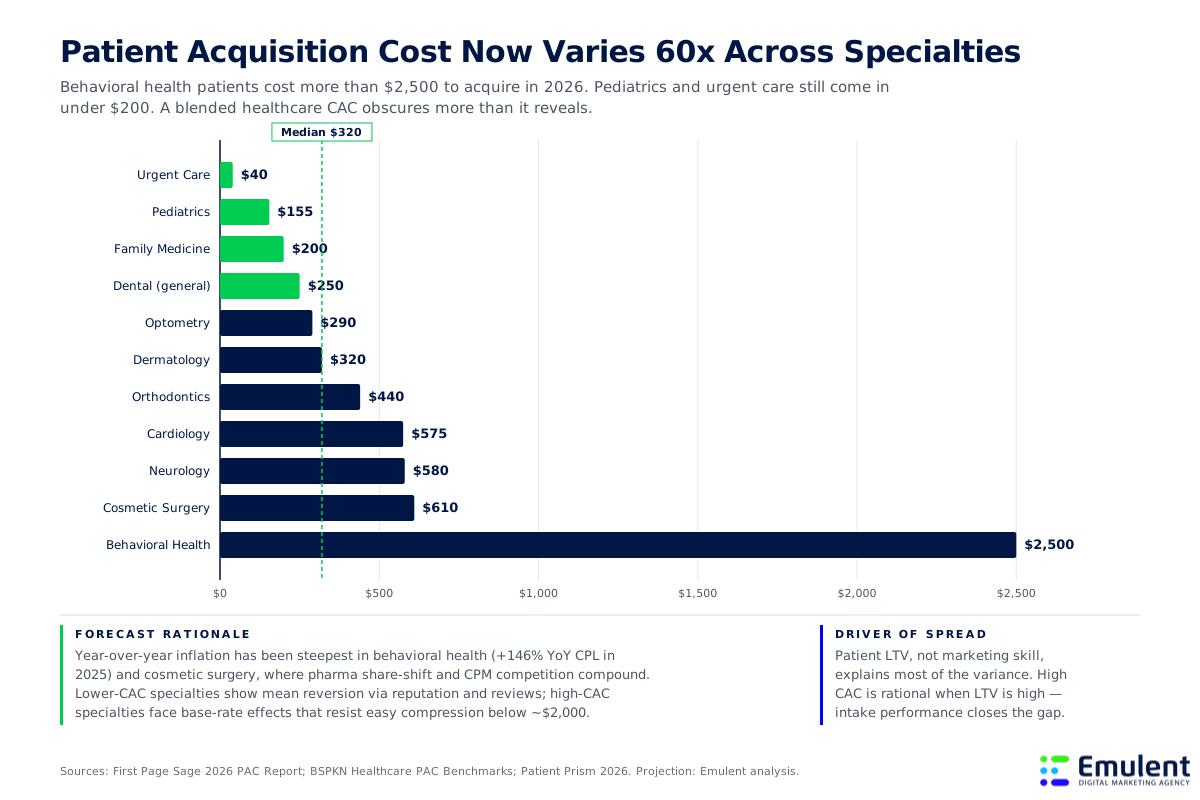
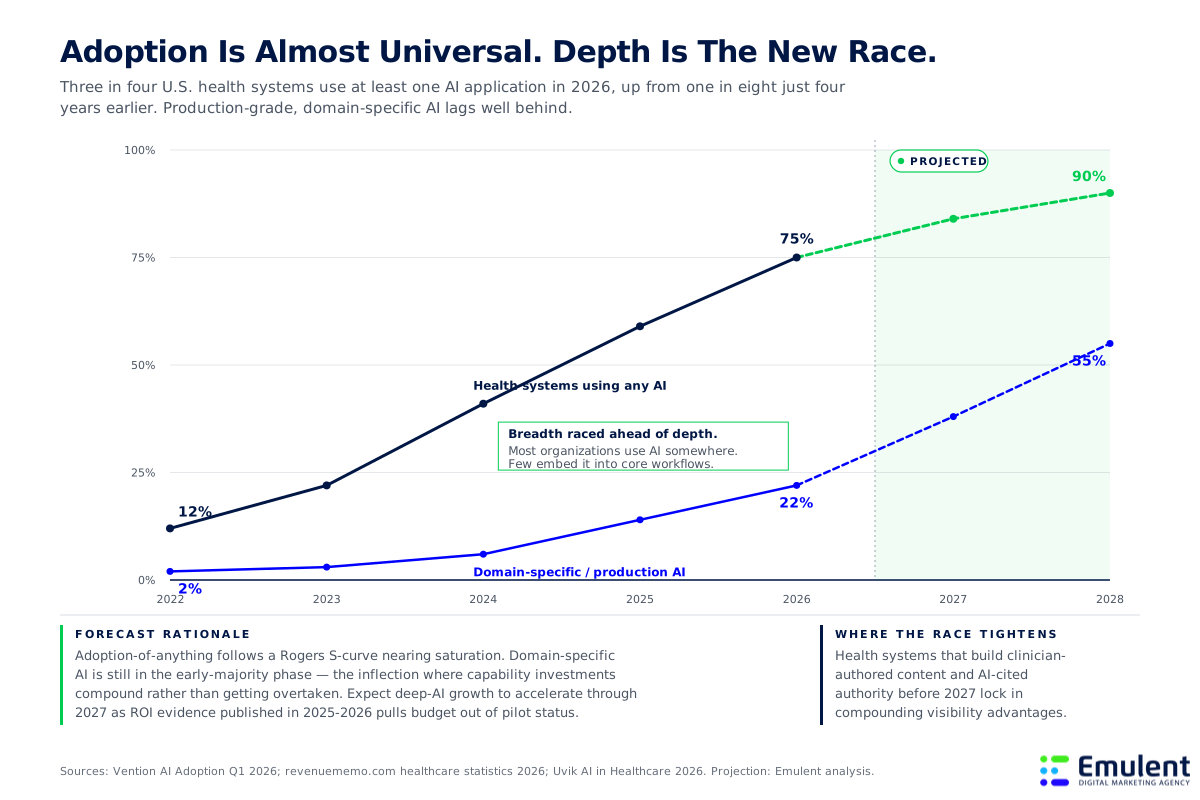
The implication is a hard reallocation of SEO effort, not a quiet trim around the edges. Where healthcare SEO investment should move: In practice, healthcare marketing teams are now running two SEO programs in parallel. One is built to earn AI Overview citation so the brand is named when the answer appears. The other is built to capture clicks where AI Overviews don’t show up. The team running only one will lose ground to the team running both. The cost of running both varies enormously by specialty, which the next chart unpacks. The 2026 First Page Sage and BSPKN benchmarks tell a story that blended industry averages obliterate. Patient acquisition cost ranges from $40 for urgent care to more than $2,500 for behavioral health and clinical trial recruitment, with most specialty practices paying between $150 and $600 per new patient. That is a 60x spread inside one industry, and the range is widening: behavioral health cost-per-lead jumped 146% year over year in 2025. The PAC variance is driven by three structural factors, not by which team has the better media buyer. What actually drives the spread: The teams reducing PAC in 2026 do four things consistently: treat online reputation as the foundation every paid channel rides on, produce authentic provider and creator video instead of polished brand spots, track phone calls as first-class conversions, and measure cost per patient acquired rather than cost per lead. AI sits inside that operational stack, and how deeply it is actually being used is the next chart. Three in four U.S. health systems use at least one AI application in 2026, up from roughly one in eight just four years earlier. That is one of the fastest adoption curves in any vertical. But the headline number obscures the more strategic one: only 22% of healthcare organizations have implemented domain-specific AI tools embedded in core workflows. Health systems lead at 27%, with outpatient providers and payers trailing at 14%. Breadth raced ahead of depth. Most organizations bought an AI feature inside an existing vendor stack. Few rebuilt processes around it. That gap is widening, and it is where the next two years of competitive advantage gets built. Expect domain-specific AI adoption to accelerate into the early-majority phase through 2027, reaching roughly 55% by 2028 as ROI evidence published in 2025 and 2026 pulls budgets out of pilot status.
“Buying an AI feature is not an AI strategy. The teams pulling ahead in 2026 rebuilt one workflow end-to-end and measured what happened. They did not buy six features and hope.” – Emulent Strategy Team
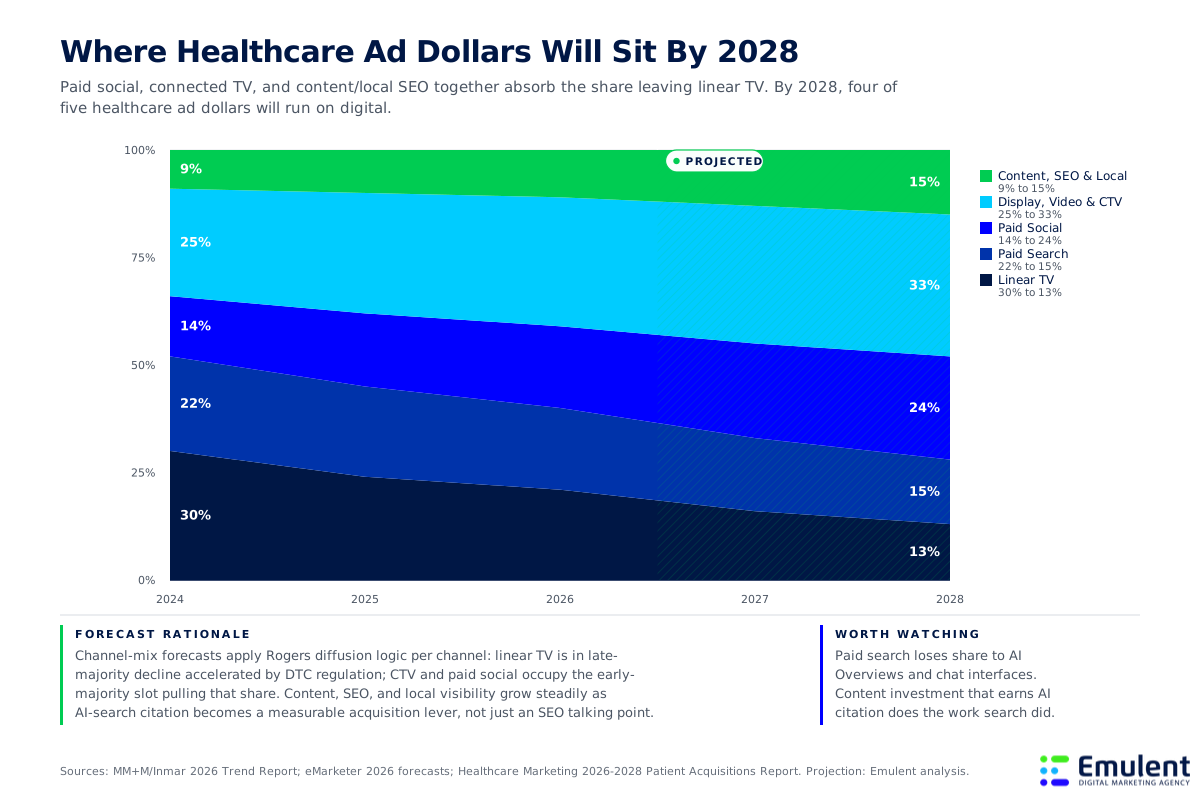
Where AI matters most for healthcare marketing teams: The teams that build AI-cited authority and clinician-authored content before 2027 lock in compounding visibility advantages. Which finally connects to the budget question: where should the actual money sit by 2028? The last chart maps that. Linear TV will not zero out, but its share of healthcare marketing budgets falls from roughly 30% in 2024 to 13% by 2028. The share moves to four channels at different rates. Paid social rises from 14% to 24%. Display, video, and connected TV (collected together) move from 25% to 33%. Content, SEO, and local visibility move from 9% to 15%. Paid search loses ground, falling from 22% to 15% as AI Overviews and chat interfaces absorb mid-funnel search demand. The deeper takeaway is what is not growing: paid search as a percentage of mix. This is the first sustained projected decline in paid search share inside healthcare in a decade, and it is structural rather than cyclical. Patients searching informational queries no longer click, which means cost per click rises for a smaller pool of remaining clickable demand. Where to invest the share that leaves paid search:
“The 2027 plan that gets approved in Q3 2026 either accounts for these shifts or quietly underperforms. There is no third option, because the patient behavior has already moved.” – Emulent Strategy Team
The healthcare organizations winning between now and 2028 will not be the ones with the biggest media budgets. They will be the ones with the cleanest attribution, the most credible provider-led content, and an operational understanding that “patient demand” is now split between clicks and AI citations. Our team at Emulent builds the measurement layer, the content engine, and the local visibility infrastructure that turns the projections in this article into measurable patient growth. If your organization is rebuilding its 2027 plan and wants a partner that has run this work inside hospital systems, specialty practices, and pharma brands, contact our team for a working session on healthcare marketing in the AI search era.
Healthcare Marketing Projections 2026-2028: Patient Acquisition in the AI Search Era
 The U.S. healthcare marketing and communications market grew to $26.52 billion in 2026, but most of that money is chasing a smaller pool of clickable patient demand. AI Overviews now intercept the majority of informational health queries before patients ever reach a provider’s website. We pulled the latest data on digital versus traditional ad spend, zero-click rates by query type, patient acquisition cost by specialty, and AI adoption across U.S. health systems to map what 2026 through 2028 actually looks like for the teams responsible for filling appointment slots.
How big is the healthcare marketing opportunity through 2028?
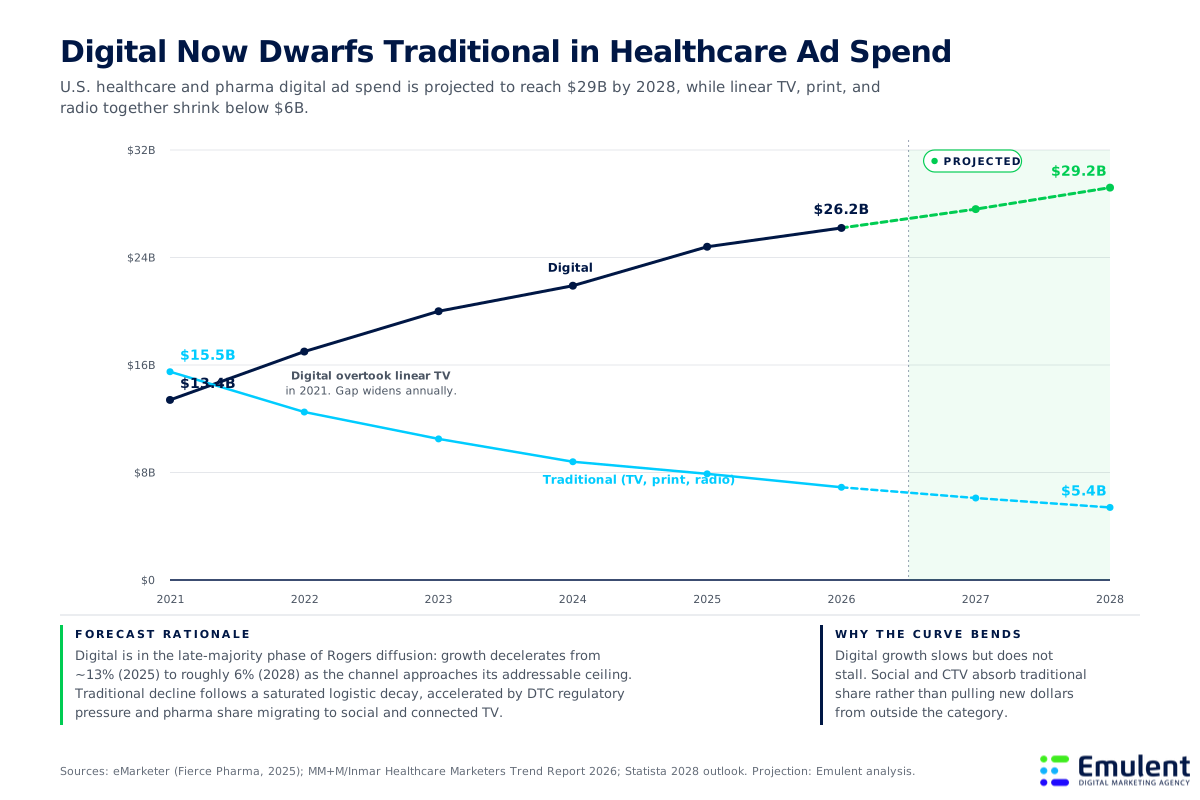
Why are healthcare searches ending without a click?
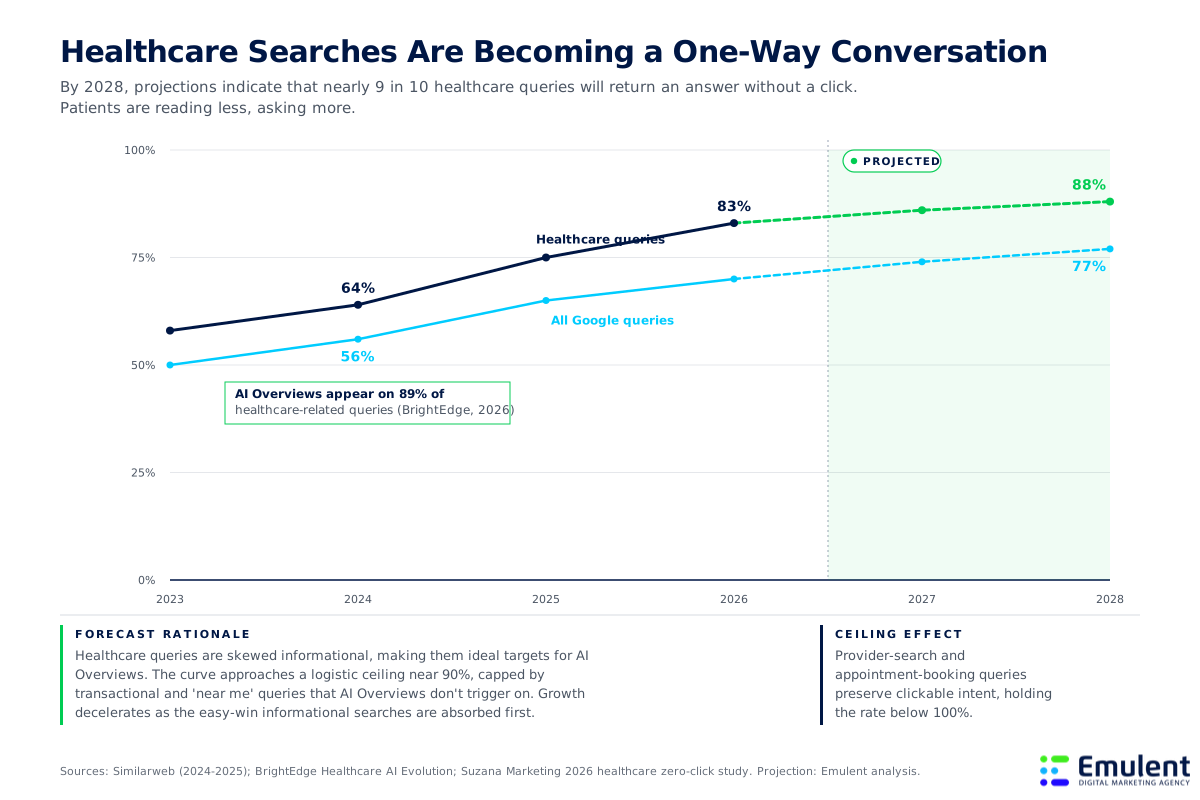
Which healthcare search types still send patients to your site?
What should you expect to pay for a new patient in 2026?
How deeply are health systems actually using AI?
Where will healthcare marketing budgets actually land by 2028?
How Emulent helps healthcare teams act on these projections